General Context
Medical ultrasound has undergone a real revolution for the last 5-10 years with the emergence of ultrafast ultrasound imaging. From frame rates between 30 and 50 FPS or a few hundreds FPS one can easily reach several thousands of frames per second. At such frame rates it is possible to observe phenomena that could not be investigated previously.
We have investigated the use of ultrafast imaging for two main applications, blood-flow and vessel wall motion imaging.
Ultrafast flow imaging
In order to estimate 2D flow profiles we have implemented ultrafast imaging using plane wave and combined it with a 2D spectral phase shift estimator
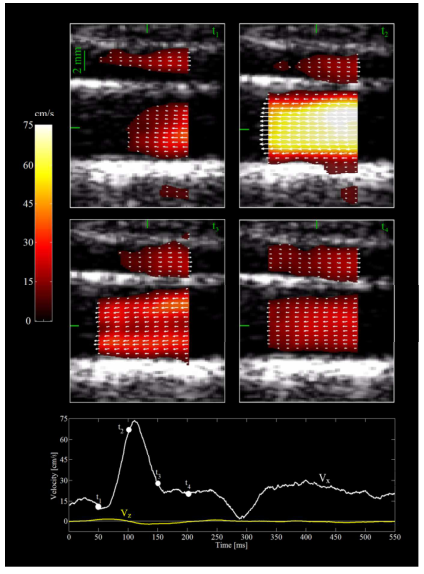
| The cover image shows four vector flow maps of the jugular vein (top) and the common carotid artery (CCA) (bottom) of a heathy volunteer. Each frame was obtained by the elaboration of 2 consecutive high frame rate images according to the 2D displacement estimation algorithm, operating in the frequency domain, which is described in the accompanying paper. The flow maps were obtained at four different phases of the cardiac cycle, spaced 50 ms apart: end diastole (t1), systolic peak (t2), systolic deceleration (t3), diastole (t4). The third map, in particular, highlights the M-shape of the spatial velocity profiles, due to the presence of consistent secondary flow. The bottom panel shows the temporal evolution of the two velocity components estimated in the CCA center. |
Ultrafast vessel wall imaging
In order to estimate the 2D trajectory of the intima-media complex of the carotid artery we have combined ultrafast imaging using plane waves, Transverse oscillations and a 2D anlytic phase shift estimator.
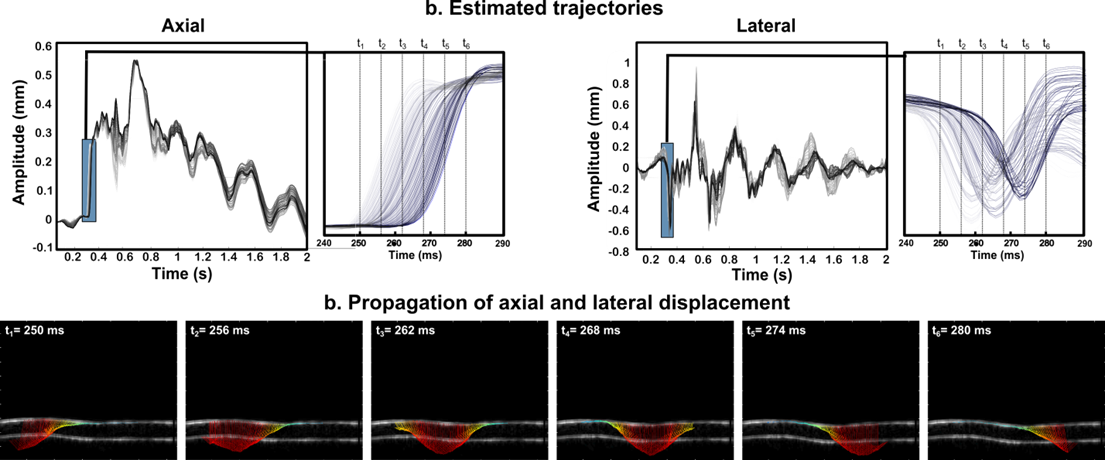
2-D Motion estimation of the soft vessel wall. a. shows all estimated trajectories all along the whole phantom in the axial and lateral directions. The line color corresponds to the position of the ROI on the vessel wall at t = 0 s. A light line color corresponds to an estimation done on the left side of the vessel and vice versa a dark line color corresponds to an estimation done on the right side of the vessel wall. A zoom is shown at the beginning of the cycle, where the propagation of the Pulse Wave was visible both in axial and lateral direction. b. shows the 2-D vessel wall velocity vectors of the soft phantom at six different time instants during the beginning of the cycle, with a time interval of 3 ms. Only the posterior wall motion is shown. The velocity vectors are color-coded according to the velocity amplitude and overlaid onto the B-mode images.