Contexte
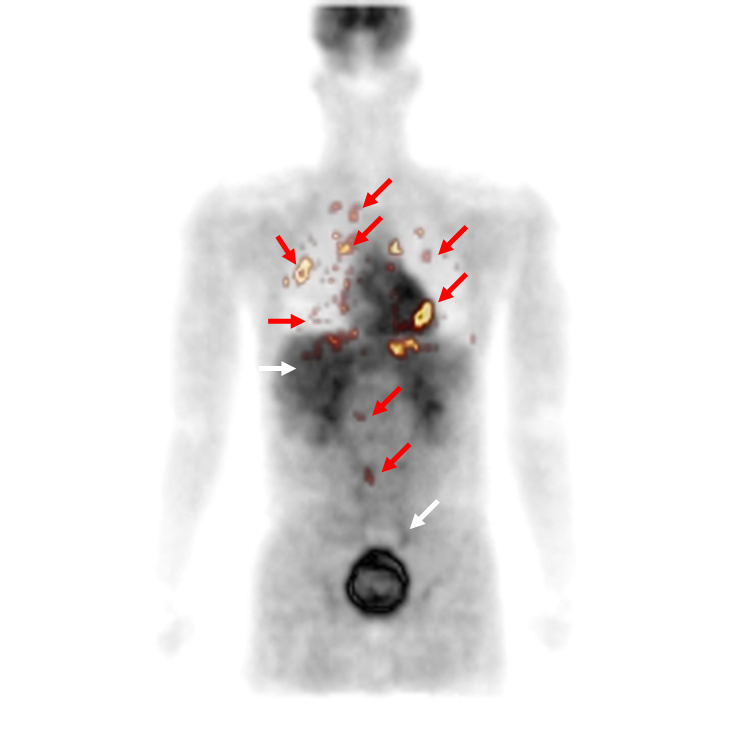
The initial staging and response assessment of lymphoma remain difficult tasks for radiologists despite the development of diagnostic imaging modalities. Integrating such a large amount of visual information is indeed complex, especially for junior radiologists with less expertise. This is all the more challenging as malignant and benign tissues may look similar in one type of modality and different in another one as is the case for lymphoma (see below)
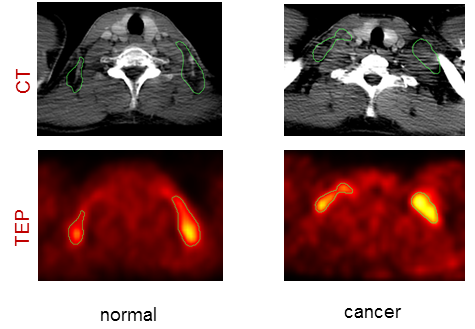
Fig 1. Example transverse slices of enhanced CT (first row) and PET (second row) of a patient with benign FDG uptake related to supraclavicular brown fat (top) and a patient with malignant FDG uptake related to supraclavicular lymphomatous nodes (bottom). This uptake is underlined by the green ROI overlaid over the CT and PET images.
Objective
The purpose of this study was to develop a decision system that performs automatic discrimination between hypermetabolic cancer lesions and hypermetabolic inflammatory or physiological but noncancerous processes in FDG PET/CT exams of lymphoma patients. The evaluation database consisted of 156 lymphomatous and 32 suspicious but non lymphomatous regions of interest.
Results
Detection performance of different machine learning algorithms was assessed based on feature sets including PET and CT characteristics derived from the clinical practice and from more sophisticated texture analysis [Lartizien, IEEE JBHI 2014]. The best performance (AUC=0.91) was achieved by combining SVM classifier with a series of 12 first- and second-order textural parameters extracted from the coregistered PET and contrast CT images. This CAD configuration was shown to significantly outperform the configuration based on PET only or 1st-order statistic only feature sets. This study showed that the combination of image texture analysis and automated decision making based on multimodal information offers a promising approach to this clinical challenge

Table 1. Optimal performance (AUC) of the SVM classifier with different training databases
Collaboration
F. Ricard, HCL, Lyon et M. Rogez, Supelec Metz
Contact
Carole.lartizien@creatis.insa-lyon.fr