(C. Cachard,H. Liebgott)
Purpose and context:
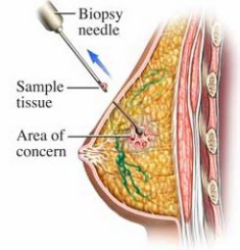
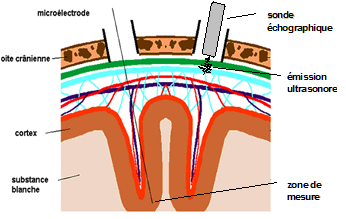
The project consists in develloping signal and image processing methods to detect linear shaped objects in 3D ultrasaound data volumes. Indeed in several medical applications there is a need to insure that a linear shaped micro tool is placed exactely at a precise location. As example we can site biopsy needles that have to be positionned correctly by the doctor who wants to take a tissue sample from inside the tumor. Also some applications where there is a need in measuring the electrical activity with a thin electrode, for example in the cortex.
Methods:
Two methods for axis localisation of the tool have been developped in the lab to estimate from the same imput data i.e. 3D ultrasound data. Both methods are based on several hypothesis:
- the shape of the needle is linear and its curvature is small
- the contrast between the needle and the background in important
Of course those are only apporimations. Difficulties that mainly come from the violation of those assumptions can appear. Especially the high contrast assumption is difficult to get for the whole needle due to speckle noise and to irregular tool appearance. Also there can be other high echogenic structures inside the tissue that can lead to difficult situations.
PIP method
This method is based on projections along all possible directions in 3D. The projection along the needle axis is detected as the one having the higest intensity.
Model Fitting
The needle axis is represented by the curve of a polynomial function. The parameters of the function are estimated by an iterative RANSAC procedure that minimizes a cost function. The simplest approach is to minimise the sum of the distances to tool axis of all high intensity voxels. The high intensity voxels are obrtained after treshholding the inmput data.
The tool tip position is estimated along tool axis as the position where the intensity drops down a fixed value.
Results:
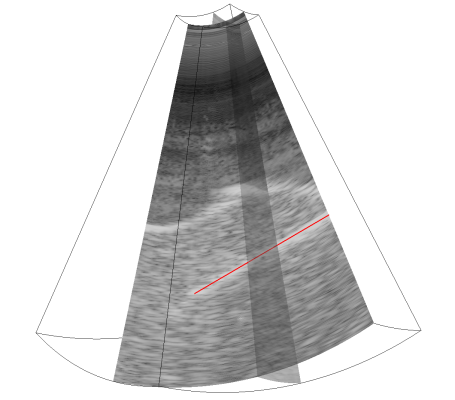
| (a) | (b) | (c) |
 |
 |
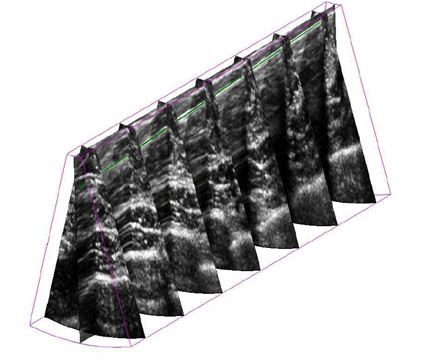 |
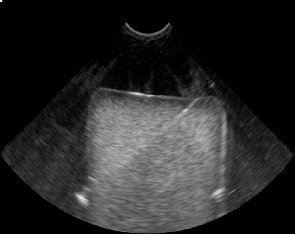
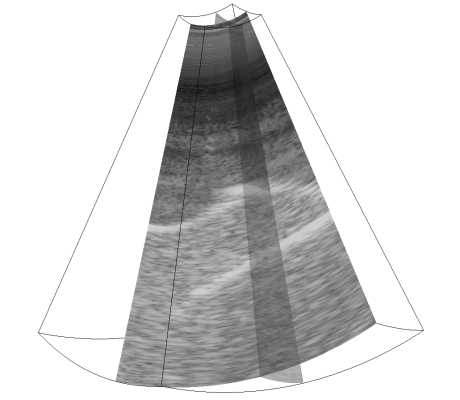
3D volume acquired on a PVA cryogel phantom with incerted needle clearly visible in (a) and with overlayed estimated needle in (b).
3D volume of breast biopsy acquired in vivo and processed with Ransac Method, and estimated needle position in (c).
Collaborations:
This project is done in collaboration with the Center for Machine Perception in Prague (Jan Kybic) and with GE Healthcare in Austria
2D matrix arrays