Purpose and Context
Our objective is to develop or adapt statistical learning algorithms, such as support vector machines (SVM), to the specificity of clinical data which include, for instance, uncertainty about the reference training data, low sample and high dimensional data.
Learning with uncertain data
Building an accurate training database is challenging in medical imaging. Radiologists, indeed, often delineate malignant and benign tissues without access to the histological ground truth, leading to uncertain data sets. Target data may thus be considered as both qualitative (a class label) or quantitative (an estimation of the posterior probability). The regular SVM learning problem was reformulated to account both for training samples with certain class labels (regular SVM) as well as uncertain samples labeled with class probability estimates [Niaf et al, IEEE TIP 2014]. We showed that this new algorithm, referred to as ‘probabilistic’ SVM (P-SVM), could be efficiently solved with regular SVM solvers. The method was first evaluated on synthetic data sets and shown to outperform the regular SVM.

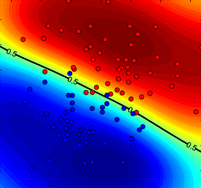
Figure 1. Comparison of P-SVM and regular SVM+Platt robustness to labelling noise. True probability distribution together with noisy learning data points (left), plotted in blue (class ‘−1’) and red (class ‘+1’) circles. Probability estimations of (middle) P-SVM (middle) SVM+Platt (right) over a grid when trained on the noisy data points.
It was then evaluated on a clinical data set of multiparametric prostate magnetic resonance images (see here) to assess its performances in discriminating benign from malignant tissues. The area under the ROC curve (AUC) were 0.862 and 0.847 for P-SVM and SVM respectively.
Collaborations
LITIS, Rouen. OCA, Lagrange Lab, Nice
Contact
carole.lartizien@creatis.insa-lyon.fr