pPlotterScaleX Class Reference
#include <pPlotterScaleX.h>

Public Member Functions | |
| pPlotterScaleX (wxString aName=wxT("X"), int flags=0x00) | |
| virtual void | Plot (wxDC &dc, mpWindow &w) |
| virtual bool | HasBBox () |
| bool | initializePolygon (wxPoint *points, double x1, double y1, double x2, double y2) |
| void | draw (wxDC &dc, mpWindow &w, double x1, double y1, double x2, double y2, int orgy) |
| void | drawSplineCurve (wxDC &dc, mpWindow &w, int orgy) |
| void | drawLineToMousePoint (wxDC &dc, mpWindow &w, int orgy) |
| void | drawFunction (wxDC &dc, mpWindow &w, int orgy) |
| void | drawPoints (wxDC &dc, mpWindow &w, int orgy) |
| virtual int | getXTraslation () |
| virtual int | getmType () |
| virtual void | getMaxShowed (int &maxX, int &maxY) |
| virtual void | getMinShowed (int &minX, int &minY) |
| virtual int | getOffsetPixelsXv () |
| virtual int | getOffsetPixelsYv () |
| virtual std::vector< double > | getXSpline () |
| virtual std::vector< double > | getYSpline () |
| virtual int | vGetType () |
| virtual void | getOffsets (int &offsetX, int &offSetY) |
| virtual void | getFactorZoom (float &fz) |
| virtual void | getIfActual (bool &actual) |
| virtual void | getMax (int &maxX, int &maxY) |
| virtual void | getScreens (int &scrX, int &scrY) |
| virtual void | setScreens (int scrX, int scrY) |
| virtual void | getScales (double &scaleX, double &scaleY) |
| virtual void | Rewind () |
| virtual bool | GetNextXY (double &x, double &y) |
| virtual void | GetPoints (wxList &points) |
| virtual void | ifShowPoints (bool &show) |
| virtual void | getDrawing (bool &draw) |
| virtual void | getMousePoint (int &x, int &y) |
| virtual void | getDirection (bool &dir) |
| virtual void | getSize (int &size) |
| virtual double | GetMinX () |
| virtual double | GetMaxX () |
| virtual double | GetMinY () |
| virtual double | GetMaxY () |
| wxString | GetName () const |
| const wxFont & | GetFont () const |
| const wxPen & | GetPen () const |
| void | SetName (wxString name) |
| void | SetFont (wxFont &font) |
| void | SetPen (wxPen &pen) |
| int | GetYTranslated (double sizey, double y) |
Protected Attributes | |
| int | m_flags |
| Holds label alignment. | |
| wxList | points |
| double | scaleX |
| double | scaleY |
| int | offsetX |
| int | offsetY |
| wxFont | m_font |
| Layer's font. | |
| wxPen | m_pen |
| Layer's pen. | |
| wxString | m_name |
| Layer's name. | |
Detailed Description
Definition at line 27 of file pPlotterScaleX.h.
Constructor & Destructor Documentation
| pPlotterScaleX::pPlotterScaleX | ( | wxString | aName = wxT("X"), |
|
| int | flags = 0x00 | |||
| ) |
This is the constructor of the class
Definition at line 24 of file pPlotterScaleX.cxx.
Member Function Documentation
| void pPlotterLayer::draw | ( | wxDC & | dc, | |
| mpWindow & | w, | |||
| double | x1, | |||
| double | y1, | |||
| double | x2, | |||
| double | y2, | |||
| int | orgy | |||
| ) | [inherited] |
Definition at line 44 of file pPlotterLayer.cxx.
References mpLayer::GetYTranslated().
Referenced by pPlotterLayer::drawFunction(), and pPlotterLayer::drawSplineCurve().
00045 {
00046
00047         //intercepts
00048         float m=((float)(y2-y1))/(x2-x1);
00049         float x0=-y1/m+x1;
00050         float y0=-m*x1+y1;
00051
00052         double sizedc = dc.GetSize().GetHeight()-orgy;
00053
00054         //analyzing the curve
00055
00056                 if(x1<=0 && x2>=0)
00057                 {
00058                         if(y2>=0 && y1>=0)
00059                                         dc.DrawLine(0,GetYTranslated(sizedc,y0), x2,GetYTranslated(sizedc,y2));
00060
00061                         else if(y2<=0 && y1>=0)
00062                         {
00063                                 if(y0>=0 && x0>=0)
00064                                         dc.DrawLine(0,GetYTranslated(sizedc,y0),x0,GetYTranslated(sizedc,0) );
00065                         }
00066                         else if(y2>=0 && y1<=0)
00067                         {
00068                                 if(y0>=0)
00069                                 dc.DrawLine(0,GetYTranslated(sizedc,y0),x2,GetYTranslated(sizedc,y2) );
00070                         }
00071
00072                 }
00073
00074                 if(x1>=0 && x2>=0)
00075                 {
00076                         if(y1>=0 && y2>=0 )
00077                                 dc.DrawLine(x1,GetYTranslated(sizedc,y1), x2,GetYTranslated(sizedc,y2));
00078                         else if(y1>=0 && y2<=0)
00079                                 dc.DrawLine(x1,GetYTranslated(sizedc,y1),x0,GetYTranslated(sizedc,0) );
00080                         else if(y1<=0 && y2>=0)
00081                                         dc.DrawLine(x0,GetYTranslated(sizedc,0),x2,GetYTranslated(sizedc,y2));
00082                 }
00083
00084
00085 }

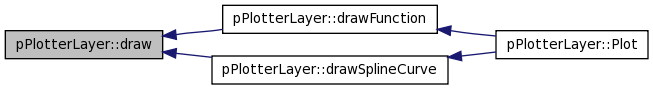
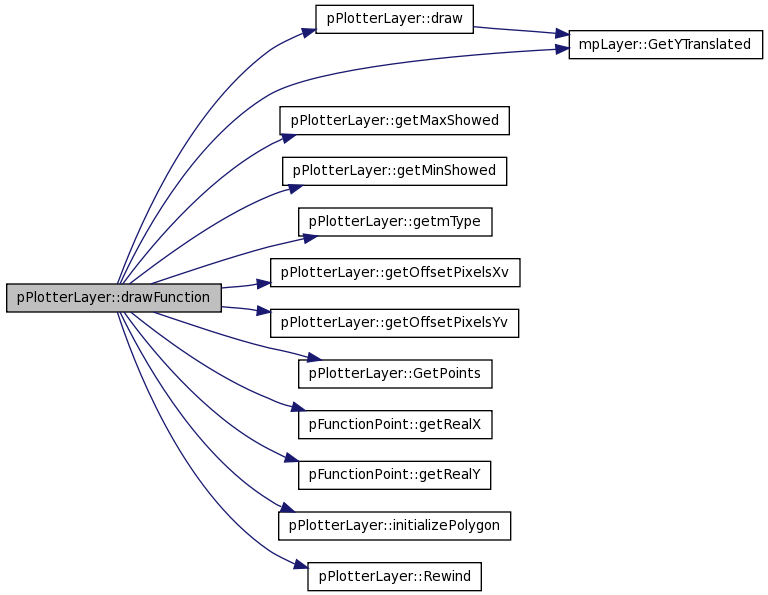
| void pPlotterLayer::drawFunction | ( | wxDC & | dc, | |
| mpWindow & | w, | |||
| int | orgy | |||
| ) | [inherited] |
Draw le lines between the points of the function
Draw the lines between the points of the function
Definition at line 290 of file pPlotterLayer.cxx.
References pPlotterLayer::draw(), pPlotterLayer::getMaxShowed(), pPlotterLayer::getMinShowed(), pPlotterLayer::getmType(), pPlotterLayer::getOffsetPixelsXv(), pPlotterLayer::getOffsetPixelsYv(), pPlotterLayer::GetPoints(), pFunctionPoint::getRealX(), pFunctionPoint::getRealY(), mpLayer::GetYTranslated(), pPlotterLayer::initializePolygon(), pPlotterLayer::offsetX, pPlotterLayer::offsetY, pPlotterLayer::points, pPlotterLayer::Rewind(), pPlotterLayer::scaleX, and pPlotterLayer::scaleY.
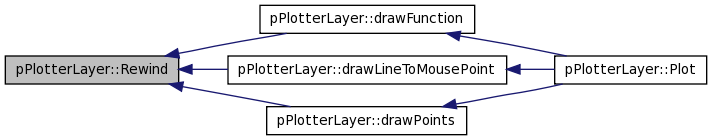
Referenced by pPlotterLayer::Plot().
00291 {
00292
00293
00294         int scrwX,scrwY,offsetpx,offsetpy,maxX,minX,maxY,minY;
00295         wxPoint* ppoints=NULL;
00296
00297         /*
00298         This is the offset of every point scale to the window
00299         pixel
00300         */
00301         offsetpx=getOffsetPixelsXv();
00302         offsetpy=getOffsetPixelsYv();
00303
00304         Rewind();
00305
00306         dc.GetSize(&scrwX, &scrwY);
00307
00308         //Lines between the points
00309
00310         int sizedc = dc.GetSize().GetHeight()-orgy;
00311
00312         GetPoints(points);
00313
00314         // type of plotter
00315         int type=getmType();
00316         /***********/
00317         getMaxShowed(maxX,maxY);
00318         getMinShowed(minX,minY);
00319         /***********/
00320
00321         //traslation
00322         //int xTraslation=getXTraslation(); //JPRx
00323         wxNode* node= points.GetFirst();
00324         // int i=1;//points.GetCount()+1; //JPRx
00325         int j=2;
00326         /*
00327          Fill it if it is an histogram
00328         */
00329         wxPoint point;
00330         // pFunctionPoint* pointk; //JPRx
00331         if(type==2)
00332         {
00333                 /*
00334                 Fill the function if it represented an histogram
00335           */
00336                 ppoints=(wxPoint*)malloc(sizeof(int)*2*(points.GetCount()+2));
00337                 //initialize points
00338                 point.x=-5000;
00339                 point.y=GetYTranslated(sizedc,-5000);
00340                 ppoints[0]=point;
00341                 ppoints[1]=point;
00342
00343         }
00344
00345
00346         while (node!=NULL && node->GetNext()!=NULL)
00347         {
00348                 pFunctionPoint* pointi=(pFunctionPoint*)node->GetData();
00349                                 wxNode* nextNode=node->GetNext();
00350                 pFunctionPoint* pointj=(pFunctionPoint*)nextNode->GetData();
00351
00352                 // we do the offset
00353                 int pxi=(pointi->getRealX()-minX)-offsetX;
00354                 int pyi=(pointi->getRealY()-minY)-offsetY;
00355                 int pxj=(pointj->getRealX()-minX)-offsetX;
00356                 int pyj=(pointj->getRealY()-minY)-offsetY;
00357
00358
00359                 int cxi=pxi* scaleX + offsetpx; //+ xTraslation;
00360                 int cxj=pxj* scaleX + offsetpx; //+ xTraslation;
00361                 int cyi=pyi* scaleY+ offsetpy ;
00362                 int cyj=pyj* scaleY+ offsetpy ;
00363                 //dc.DrawLine(pxi* scaleX + offsetpx,pyi* scaleY+ offsetpy, pxj* scaleX + offsetpx,pyj* scaleY+ offsetpy );
00364                 if(type!=2)
00365                         draw(dc,w,pxi* scaleX + offsetpx,pyi* scaleY+ offsetpy, pxj* scaleX + offsetpx,pyj* scaleY+ offsetpy,orgy );
00366                         //dc.DrawLine(pxi* scaleX + offsetpx,pyi* scaleY+ offsetpy, pxj* scaleX + offsetpx,pyj* scaleY+ offsetpy );
00367                 else if(type==2)
00368                 {
00369                         if(!initializePolygon(ppoints,cxi,cyi,cxj,cyj) && ((cxi<=0 && cxj>=0)||(cxi>=0 && cxj>=0)))
00370                         {
00371                                         point.x=cxj;
00372                                         point.y=GetYTranslated(sizedc,cyj);
00373                                         ppoints[j]=point;
00374                                         j++;
00375
00376                         }
00377                 }
00378
00379                 node=node->GetNext();
00380
00381         }
00382         if(type==2)
00383         {
00384                 //point.x=vx.at(size-1)* scaleX + offsetpx;
00385                 point.x=ppoints[j-1].x;
00386                 point.y=GetYTranslated(sizedc,0);
00387                 //ppoints[vx.size()]=point;
00388                 ppoints[j]=point;
00389                 /*
00390                 Fill the function if it represented an histogram
00391           */
00392                 //ppoints=(wxPoint*)malloc(sizeof(int)*2*(vx.size()+1));
00393                 //settings for fill
00394                 //point.x=vx.at(0)*scaleX + offsetpx;
00395                 point.x=ppoints[0].x;
00396                 point.y=GetYTranslated(sizedc,0);
00397                 //ppoints[vx.size()+1]=point;
00398                 ppoints[j+1]=point;
00399
00400                 dc.SetBrush(wxBrush( wxColour(239,238,242) ,wxSOLID  ));
00401                 dc.SetPen(wxPen( wxColour(0,0,0) ,1,wxSOLID  ));
00402                 //dc.DrawPolygon(vx.size()+2,ppoints,0,0);
00403                 dc.DrawPolygon(j+2,ppoints,0,0);
00404
00405         }
00406
00407 }

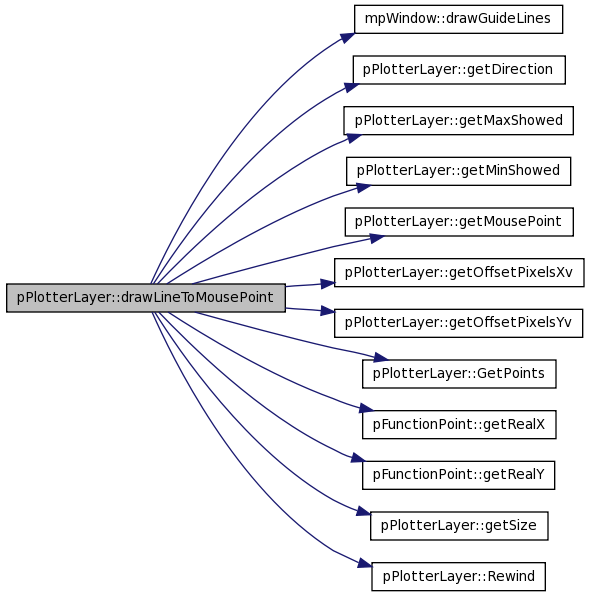
| void pPlotterLayer::drawLineToMousePoint | ( | wxDC & | dc, | |
| mpWindow & | w, | |||
| int | orgy | |||
| ) | [inherited] |
Draw the line between the last point of the function and the position of the mouse
Definition at line 461 of file pPlotterLayer.cxx.
References mpWindow::drawGuideLines(), pPlotterLayer::getDirection(), pPlotterLayer::getMaxShowed(), pPlotterLayer::getMinShowed(), pPlotterLayer::getMousePoint(), pPlotterLayer::getOffsetPixelsXv(), pPlotterLayer::getOffsetPixelsYv(), pPlotterLayer::GetPoints(), pFunctionPoint::getRealX(), pFunctionPoint::getRealY(), pPlotterLayer::getSize(), pPlotterLayer::offsetX, pPlotterLayer::offsetY, pPlotterLayer::points, pPlotterLayer::Rewind(), pPlotterLayer::scaleX, and pPlotterLayer::scaleY.
Referenced by pPlotterLayer::Plot().
00462 {
00463         int x,y,sizeP,maxX,maxY,minX,minY;
00464         bool direction;
00465
00466         Rewind();
00467
00468         getMousePoint(x,y);
00469         getDirection(direction);
00470         getSize(sizeP);
00471         //Lines betwen the points
00472         GetPoints(points);
00473
00474         wxNode *node=points.GetLast();
00475         wxNode *node1=points.GetFirst();
00476
00477
00478         /*
00479         This is the offset of every point scale to the window
00480         pixel
00481         */
00482         int offsetpx = getOffsetPixelsXv();
00483         int offsetpy = getOffsetPixelsYv();
00484         /***********/
00485         getMaxShowed(maxX,maxY);
00486         getMinShowed(minX,minY);
00487         /***********/
00488         //traslation
00489 //      int xTraslation=getXTraslation(); //EED
00490
00491         if(node)
00492         {
00493                 pFunctionPoint* lastPoint=(pFunctionPoint*)node->GetData();
00494                 pFunctionPoint* firstPoint=(pFunctionPoint*)node1->GetData();
00495
00496                 //LeftDrawing
00497                 if(lastPoint->getRealX()<x && direction && sizeP >=2)
00498
00499                         dc.DrawLine((lastPoint->getRealX()-minX-offsetX)*scaleX + offsetpx,(lastPoint->getRealY()-minY-offsetY)*scaleY+ offsetpy, (x-minX)*scaleX + offsetpx, (y-minY)*scaleY + offsetpy);
00500
00501                 //right drawing
00502                 else if(firstPoint->getRealX()>x && !direction && sizeP >=2 )
00503
00504                         dc.DrawLine((firstPoint->getRealX()-minX-offsetX)*scaleX+ offsetpx,(firstPoint->getRealY()-minY-offsetY)*scaleY+ offsetpy,(x-minX)*scaleX+ offsetpx, (y-minY)*scaleY+ offsetpy);
00505
00506                 //just a point
00507                 else if(sizeP==1 )
00508                 {
00509                         dc.DrawLine((lastPoint->getRealX()-minX-offsetX)*scaleX + offsetpx,(lastPoint->getRealY()-minY-offsetY)*scaleY+ offsetpy, (x-minX)*scaleX+ offsetpx, (y-minY)*scaleY+ offsetpy);
00510                 }
00511         }
00512
00513         if( w.drawGuideLines() )
00514         {
00515                 dc.SetPen(wxPen(  wxColour(255,0,0),1,wxDOT ));
00516                 // Drawing the horizontal guide line
00517                 dc.DrawLine( 0, (y-minY)*scaleY + offsetpy, (x-minX)*scaleX + offsetpx, (y-minY)*scaleY + offsetpy);
00518                 // Drawing the vertical guide line
00519                 dc.DrawLine( (x-minX)*scaleX + offsetpx,0, (x-minX)*scaleX + offsetpx, (y-minY)*scaleY + offsetpy);
00520         }
00521 }

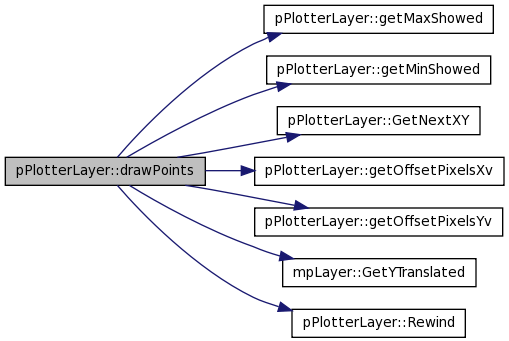
| void pPlotterLayer::drawPoints | ( | wxDC & | dc, | |
| mpWindow & | w, | |||
| int | orgy | |||
| ) | [inherited] |
Draw the points of the function
Definition at line 412 of file pPlotterLayer.cxx.
References pPlotterLayer::getMaxShowed(), pPlotterLayer::getMinShowed(), pPlotterLayer::GetNextXY(), pPlotterLayer::getOffsetPixelsXv(), pPlotterLayer::getOffsetPixelsYv(), mpLayer::GetYTranslated(), MOVE, pPlotterLayer::offsetX, pPlotterLayer::offsetY, pPlotterLayer::points, pPlotterLayer::Rewind(), pPlotterLayer::scaleX, and pPlotterLayer::scaleY.
Referenced by pPlotterLayer::Plot().
00413 {
00414
00415         Rewind();
00416         double x, y;
00417         int minX,maxX,minY,maxY;
00418
00419         double sizedc = dc.GetSize().GetHeight()-orgy;
00420
00421         /*
00422         This is the offset of every point scale to the window
00423         pixel
00424         */
00425         int offsetpx=getOffsetPixelsXv();
00426         int offsetpy=getOffsetPixelsYv();
00427         //traslation
00428 //      int xTraslation=getXTraslation();  //EED
00429         /*wxPen mypen(*wxBLACK, 5, wxSOLID);
00430         dc.SetPen(mypen);*/
00431         /***********/
00432         getMaxShowed(maxX,maxY);
00433         getMinShowed(minX,minY);
00434         /***********/
00435         //we have to draw the points
00436
00437         while (GetNextXY(x, y))
00438         {
00439                 //GetNextXY(x, y);
00440                 //set the points of the polygons
00441                 wxPoint points[4];
00442                 dc.SetBrush(wxBrush( wxColour(255,0,0),wxSOLID  ));
00443                 //dc.SetPen(wxPen(wxColour(0,0,0),1,wxSOLID) );
00444                 points[0].x=((x-minX-offsetX)*scaleX + offsetpx-MOVE);
00445                 points[0].y=GetYTranslated(sizedc,((y-minY-offsetY)*scaleY+ offsetpy-MOVE));
00446                 points[1].x=((x-minX-offsetX)*scaleX+ offsetpx+MOVE);
00447                 points[1].y=GetYTranslated(sizedc,((y-minY-offsetY)*scaleY+ offsetpy-MOVE));
00448                 points[2].x=((x-minX-offsetX)*scaleX+ offsetpx+MOVE);
00449                 points[2].y=GetYTranslated(sizedc,((y-minY-offsetY)*scaleY+ offsetpy+MOVE));
00450                 points[3].x=((x-minX-offsetX)*scaleX+ offsetpx-MOVE);
00451                 points[3].y=GetYTranslated(sizedc,((y-minY-offsetY)*scaleY+ offsetpy+MOVE));
00452                 if((x-minX-offsetX)*scaleX >=0 && (y-minY-offsetY/*w.getMinScrY()*/)*scaleY>=0)
00453                 dc.DrawPolygon(4,points,0,0);
00454         }
00455 }

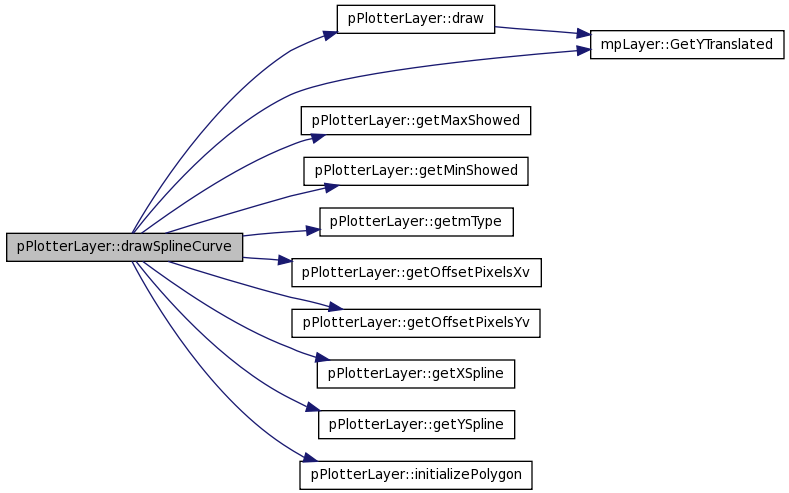
| void pPlotterLayer::drawSplineCurve | ( | wxDC & | dc, | |
| mpWindow & | w, | |||
| int | orgy | |||
| ) | [inherited] |
Draw the function with th spline points
Definition at line 91 of file pPlotterLayer.cxx.
References pPlotterLayer::draw(), pPlotterLayer::getMaxShowed(), pPlotterLayer::getMinShowed(), pPlotterLayer::getmType(), pPlotterLayer::getOffsetPixelsXv(), pPlotterLayer::getOffsetPixelsYv(), pPlotterLayer::getXSpline(), pPlotterLayer::getYSpline(), mpLayer::GetYTranslated(), pPlotterLayer::initializePolygon(), pPlotterLayer::offsetX, pPlotterLayer::offsetY, pPlotterLayer::scaleX, and pPlotterLayer::scaleY.
Referenced by pPlotterLayer::Plot().
00092 {
00093         std::vector<double> vx=getXSpline();
00094         std::vector<double> vy=getYSpline();
00095         wxPoint* ppoints;
00096
00097         int /*counter=0,*/ minX,maxX,minY,maxY; // JPRx
00098         /*
00099         This is the offset of every point scale to the window
00100         pixel
00101         */
00102         int offsetpx=getOffsetPixelsXv();
00103         int offsetpy=getOffsetPixelsYv();
00104
00105         // type of plotter
00106         int type=getmType();
00107
00108         wxPoint point;
00109         /***********/
00110         getMaxShowed(maxX,maxY);
00111         getMinShowed(minX,minY);
00112         /***********/
00113
00114
00115         if(type==2)
00116         {
00117          /*
00118                 Fill the function if it represented an histogram
00119           */
00120                 ppoints=(wxPoint*)malloc(sizeof(int)*2*(vx.size()+2));
00121                 //initialize points
00122                 point.x=-5000;
00123                 point.y=-5000;
00124                 ppoints[0]=point;
00125                 ppoints[1]=point;
00126         }
00127
00128         int size=vx.size();
00129         int j=2;
00130
00131         for(int i=0;(i+1)< size;i++)
00132         {
00133
00134
00135                 double cxi=(vx.at(i)-minX-offsetX)*scaleX+offsetpx;
00136                 double cyi=(vy.at(i)-minY-offsetY)*scaleY+offsetpy;
00137
00138                 double cxj=(vx.at(i+1)-minX-offsetX)*scaleX+offsetpx;
00139                 double cyj=(vy.at(i+1)-minY-offsetY)*scaleY+offsetpy;
00140
00141
00142                 if(type!=2)
00143                         draw(dc,w,cxi,cyi,cxj,cyj,orgy);
00144                 else if(type==2)
00145                 {
00146                         if(!initializePolygon(ppoints,cxi,cyi,cxj,cyj) && ((cxi<=0 && cxj>=0)||(cxi>=0 && cxj>=0)))
00147                         {
00148                                         point.x=cxj;
00149                                         point.y=cyj;
00150                                         ppoints[j]=point;
00151                                         j++;
00152
00153                         }
00154                 }
00155
00156         }
00157         if(type==2)
00158         {
00159                 //point.x=vx.at(size-1)* scaleX + offsetpx;
00160                 point.x=ppoints[j-1].x;
00161                 point.y=0;
00162                 //ppoints[vx.size()]=point;
00163                 ppoints[j]=point;
00164                 /*
00165                 Fill the function if it represented an histogram
00166           */
00167                 //ppoints=(wxPoint*)malloc(sizeof(int)*2*(vx.size()+1));
00168                 //settings for fill
00169                 //point.x=vx.at(0)*scaleX + offsetpx;
00170                 point.x=ppoints[0].x;
00171                 point.y=0;
00172                 //ppoints[vx.size()+1]=point;
00173                 ppoints[j+1]=point;
00174
00175                 dc.SetBrush(wxBrush( wxColour(239,238,242) ,wxSOLID  ));
00176                 dc.SetPen(wxPen( wxColour(0,0,0) ,1,wxSOLID  ));
00177                 //dc.DrawPolygon(vx.size()+2,ppoints,0,0);
00178                 for(int i = 0; i <= j + 1; i++){
00179                         int sizedc = dc.GetSize().GetHeight()-orgy;
00180                         ppoints[i].y = GetYTranslated(sizedc, ppoints[i].y);
00181                 }
00182                 dc.DrawPolygon(j+2,ppoints,0,0);
00183         }
00184
00185
00186 }

| virtual void pPlotterLayer::getDirection | ( | bool & | dir | ) | [inline, virtual, inherited] |
this method gets the direction of the drawing
Reimplemented in pGraphicalFunction.
Definition at line 220 of file pPlotterLayer.h.
Referenced by pPlotterLayer::drawLineToMousePoint().

| virtual void pPlotterLayer::getDrawing | ( | bool & | draw | ) | [inline, virtual, inherited] |
Let us Know if the user has finished the drawing that starts before.
Reimplemented in pGraphicalFunction.
Definition at line 212 of file pPlotterLayer.h.
Referenced by pPlotterLayer::Plot().

| virtual void pPlotterLayer::getFactorZoom | ( | float & | fz | ) | [inline, virtual, inherited] |
Reimplemented in pGraphicalFunction.
Definition at line 152 of file pPlotterLayer.h.
Referenced by pPlotterLayer::Plot().

| const wxFont& mpLayer::GetFont | ( | ) | const [inline, inherited] |
Get font set for this layer.
- Returns:
- Font
Definition at line 175 of file mathplot.h.
00175 { return m_font; }
| virtual void pPlotterLayer::getIfActual | ( | bool & | actual | ) | [inline, virtual, inherited] |
if the function that is drawing is the actual
Reimplemented in pGraphicalFunction.
Definition at line 156 of file pPlotterLayer.h.
Referenced by pPlotterLayer::Plot().

| virtual void pPlotterLayer::getMax | ( | int & | maxX, | |
| int & | maxY | |||
| ) | [inline, virtual, inherited] |
get the max of the function in x and y
Reimplemented in pGraphicalFunction.
Definition at line 162 of file pPlotterLayer.h.
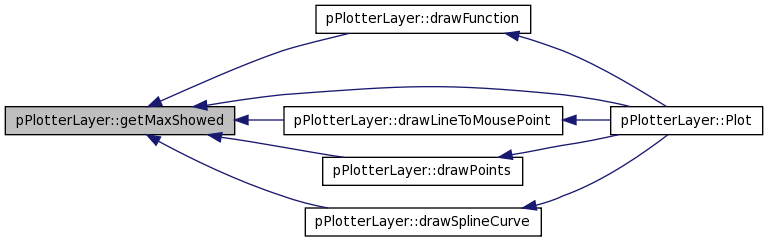
| virtual void pPlotterLayer::getMaxShowed | ( | int & | maxX, | |
| int & | maxY | |||
| ) | [inline, virtual, inherited] |
get the maxShowed of the function in x and y
Reimplemented in pGraphicalFunction.
Definition at line 92 of file pPlotterLayer.h.
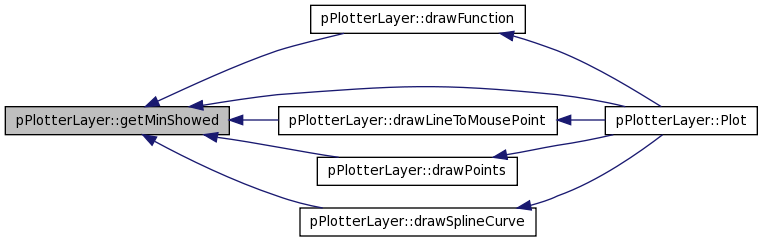
Referenced by pPlotterLayer::drawFunction(), pPlotterLayer::drawLineToMousePoint(), pPlotterLayer::drawPoints(), pPlotterLayer::drawSplineCurve(), and pPlotterLayer::Plot().
| virtual double mpLayer::GetMaxX | ( | ) | [inline, virtual, inherited] |
Get inclusive right border of bounding box.
- Returns:
- Value
Definition at line 120 of file mathplot.h.
Referenced by mpWindow::UpdateBBox().

| virtual double mpLayer::GetMaxY | ( | ) | [inline, virtual, inherited] |
Get inclusive top border of bounding box.
- Returns:
- Value
Definition at line 130 of file mathplot.h.
Referenced by mpWindow::UpdateBBox().
| virtual void pPlotterLayer::getMinShowed | ( | int & | minX, | |
| int & | minY | |||
| ) | [inline, virtual, inherited] |
get the minShowed of the function in x and y
Reimplemented in pGraphicalFunction.
Definition at line 98 of file pPlotterLayer.h.
Referenced by pPlotterLayer::drawFunction(), pPlotterLayer::drawLineToMousePoint(), pPlotterLayer::drawPoints(), pPlotterLayer::drawSplineCurve(), and pPlotterLayer::Plot().
| virtual double mpLayer::GetMinX | ( | ) | [inline, virtual, inherited] |
Get inclusive left border of bounding box.
- Returns:
- Value
Definition at line 115 of file mathplot.h.
Referenced by mpWindow::UpdateBBox().

| virtual double mpLayer::GetMinY | ( | ) | [inline, virtual, inherited] |
Get inclusive bottom border of bounding box.
- Returns:
- Value
Definition at line 125 of file mathplot.h.
Referenced by mpWindow::UpdateBBox().
| virtual void pPlotterLayer::getMousePoint | ( | int & | x, | |
| int & | y | |||
| ) | [inline, virtual, inherited] |
Reimplemented in pGraphicalFunction.
Definition at line 216 of file pPlotterLayer.h.
Referenced by pPlotterLayer::drawLineToMousePoint().

| virtual int pPlotterLayer::getmType | ( | ) | [inline, virtual, inherited] |
Get the type of the curve 1=normal function 2=Histogram
Reimplemented in pGraphicalFunction.
Definition at line 85 of file pPlotterLayer.h.
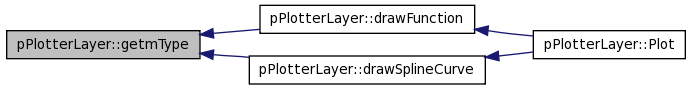
Referenced by pPlotterLayer::drawFunction(), and pPlotterLayer::drawSplineCurve().
| wxString mpLayer::GetName | ( | ) | const [inline, inherited] |
| virtual bool pPlotterLayer::GetNextXY | ( | double & | x, | |
| double & | y | |||
| ) | [inline, virtual, inherited] |
Get locus value for next N. Override this function in your implementation.
- Parameters:
-
x Returns X value y Returns Y value
Reimplemented in pGraphicalFunction.
Definition at line 189 of file pPlotterLayer.h.
Referenced by pPlotterLayer::drawPoints().

| virtual int pPlotterLayer::getOffsetPixelsXv | ( | ) | [inline, virtual, inherited] |
Gets the x-offset of the zoom in pixels
Reimplemented in pGraphicalFunction.
Definition at line 106 of file pPlotterLayer.h.
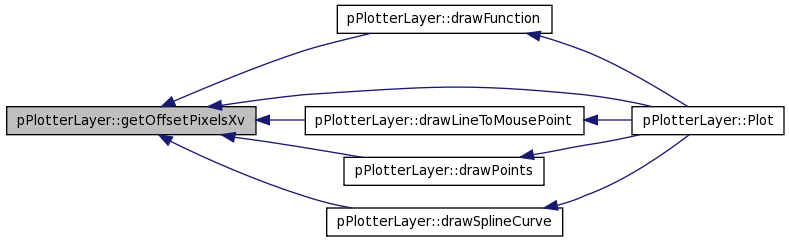
Referenced by pPlotterLayer::drawFunction(), pPlotterLayer::drawLineToMousePoint(), pPlotterLayer::drawPoints(), pPlotterLayer::drawSplineCurve(), and pPlotterLayer::Plot().
| virtual int pPlotterLayer::getOffsetPixelsYv | ( | ) | [inline, virtual, inherited] |
Gets the Y-offset of the zoom in pixels
Reimplemented in pGraphicalFunction.
Definition at line 113 of file pPlotterLayer.h.
Referenced by pPlotterLayer::drawFunction(), pPlotterLayer::drawLineToMousePoint(), pPlotterLayer::drawPoints(), and pPlotterLayer::drawSplineCurve().
| virtual void pPlotterLayer::getOffsets | ( | int & | offsetX, | |
| int & | offSetY | |||
| ) | [inline, virtual, inherited] |
Get _offsetX and _offsetY
Reimplemented in pGraphicalFunction.
Definition at line 146 of file pPlotterLayer.h.
Referenced by pPlotterLayer::Plot().

| const wxPen& mpLayer::GetPen | ( | ) | const [inline, inherited] |
Get pen set for this layer.
- Returns:
- Pen
Definition at line 180 of file mathplot.h.
00180 { return m_pen; }
| virtual void pPlotterLayer::GetPoints | ( | wxList & | points | ) | [inline, virtual, inherited] |
Get Point list of the funcion
- Parameters:
-
return points
Reimplemented in pGraphicalFunction.
Definition at line 195 of file pPlotterLayer.h.
Referenced by pPlotterLayer::drawFunction(), and pPlotterLayer::drawLineToMousePoint().
| virtual void pPlotterLayer::getScales | ( | double & | scaleX, | |
| double & | scaleY | |||
| ) | [inline, virtual, inherited] |
Let us know the scale of the function
Reimplemented in pGraphicalFunction.
Definition at line 177 of file pPlotterLayer.h.
| virtual void pPlotterLayer::getScreens | ( | int & | scrX, | |
| int & | scrY | |||
| ) | [inline, virtual, inherited] |
Get screens of the function
Reimplemented in pGraphicalFunction.
Definition at line 167 of file pPlotterLayer.h.
| virtual void pPlotterLayer::getSize | ( | int & | size | ) | [inline, virtual, inherited] |
Get the number of points of the function
Reimplemented in pGraphicalFunction.
Definition at line 224 of file pPlotterLayer.h.
Referenced by pPlotterLayer::drawLineToMousePoint().

| virtual std::vector<double> pPlotterLayer::getXSpline | ( | ) | [inline, virtual, inherited] |
Reimplemented in pGraphicalFunction.
Definition at line 119 of file pPlotterLayer.h.
Referenced by pPlotterLayer::drawSplineCurve().

| virtual int pPlotterLayer::getXTraslation | ( | ) | [inline, virtual, inherited] |
Get the value of the traslation in the x-axis
Reimplemented in pGraphicalFunction.
Definition at line 76 of file pPlotterLayer.h.
| virtual std::vector<double> pPlotterLayer::getYSpline | ( | ) | [inline, virtual, inherited] |
Reimplemented in pGraphicalFunction.
Definition at line 127 of file pPlotterLayer.h.
Referenced by pPlotterLayer::drawSplineCurve().

| int mpLayer::GetYTranslated | ( | double | sizey, | |
| double | y | |||
| ) | [inline, inherited] |
Get the translation of the Y coordinate acoording to the new orientation of the axis du to the problem identified in MACOS with the funtion 'SetAxisOrientation'
Definition at line 201 of file mathplot.h.
Referenced by pPlotterLayer::draw(), pPlotterLayer::drawFunction(), pPlotterLayer::drawPoints(), pPlotterLayer::drawSplineCurve(), pPlotterScaleY::Plot(), Plot(), pPlotterLayer::Plot(), and mpScaleY::Plot().
| virtual bool pPlotterScaleX::HasBBox | ( | ) | [inline, virtual] |
Check whether this layer has a bounding box. This implementation returns FALSE thus making the ruler invisible to the plot layer bounding box calculation by mpWindow.
Reimplemented from mpLayer.
Definition at line 42 of file pPlotterScaleX.h.
| virtual void pPlotterLayer::ifShowPoints | ( | bool & | show | ) | [inline, virtual, inherited] |
Let us Know if the user want to see the points of the function of other color than the color of the lines
Reimplemented in pGraphicalFunction.
Definition at line 206 of file pPlotterLayer.h.
Referenced by pPlotterLayer::Plot().

| bool pPlotterLayer::initializePolygon | ( | wxPoint * | points, | |
| double | x1, | |||
| double | y1, | |||
| double | x2, | |||
| double | y2 | |||
| ) | [inherited] |
Definition at line 192 of file pPlotterLayer.cxx.
Referenced by pPlotterLayer::drawFunction(), and pPlotterLayer::drawSplineCurve().
00193 {
00194         bool setted=false;
00195
00196                 //intercepts
00197         float m=((float)(y2-y1))/(x2-x1);
00198         float x0=-y1/m+x1;
00199         float y0=-m*x1+y1;
00200
00201         if(points[0].x<=0&& points[1].x<=0 && points[0].y<=0&& points[1].y<=0)
00202         {
00203
00204                 //int offsetpx=getOffsetPixelsXv(); //JPRx
00205
00206                 //analyzing the curve
00207
00208                         if(x1<=0 && x2>=0)
00209                         {
00210                                 if(y2>=0 && y1>=0)
00211                                 {
00212                                                 //dc.DrawLine(0,y0, x2,y2);
00213                                                 points[0].x=0;
00214                                                 points[0].y=y0;
00215                                                 points[1].x=x2;
00216                                                 points[1].y=y2;
00217                                                 setted=true;
00218
00219                                 }
00220                                 else if(y2<=0 && y1>=0)
00221                                 {
00222                                         if(y0>=0 && x0>=0)
00223                                         {
00224                                                 //dc.DrawLine(0,y0,x0,0 );
00225                                                 points[0].x=0;
00226                                                 points[0].y=y0;
00227                                                 points[1].x=x0;
00228                                                 points[1].y=0;
00229                                                 setted=true;
00230
00231                                         }
00232
00233                                 }
00234                                 else if(y2>=0 && y1<=0)
00235                                 {
00236                                         if(y0>=0)
00237                                         {
00238                                                 //dc.DrawLine(0,y0,x2,y2 );
00239                                                 points[0].x=0;
00240                                                 points[0].y=y0;
00241                                                 points[1].x=x2;
00242                                                 points[1].y=y2;
00243                                                 setted=true;
00244                                         }
00245                                 }
00246
00247                         }
00248
00249                         if(x1>=0 && x2>=0)
00250                         {
00251                                 if(y1>=0 && y2>=0 )
00252                                 {
00253                                         //dc.DrawLine(x1,y1, x2,y2);
00254                                         points[0].x=x1;
00255                                         points[0].y=y1;
00256                                         points[1].x=x2;
00257                                         points[1].y=y2;
00258                                         setted=true;
00259                                 }
00260                                 else if(y1>=0 && y2<=0)
00261                                 {
00262                                         //dc.DrawLine(x1,y1,x0,0 );
00263                                         points[0].x=x1;
00264                                         points[0].y=y1;
00265                                         points[1].x=x0;
00266                                         points[1].y=0;
00267                                         setted=true;
00268                                 }
00269                                 else if(y1<=0 && y2>=0)
00270                                 {
00271                                         //dc.DrawLine(x0,0,x2,y2);
00272                                         points[0].x=x0;
00273                                         points[0].y=0;
00274                                         points[1].x=x2;
00275                                         points[1].y=y2;
00276                                         setted=true;
00277                                 }
00278                         }
00279                         else
00280                         return setted;
00281         }
00282         else
00283                 return setted;
00284         return setted;
00285 }
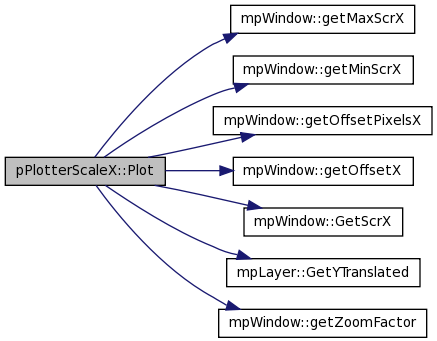
| void pPlotterScaleX::Plot | ( | wxDC & | dc, | |
| mpWindow & | w | |||
| ) | [virtual] |
This is how the x-axis draw itself
Reimplemented from pPlotterLayer.
Definition at line 35 of file pPlotterScaleX.cxx.
References mpWindow::getMaxScrX(), mpWindow::getMinScrX(), mpWindow::getOffsetPixelsX(), mpWindow::getOffsetX(), mpWindow::GetScrX(), mpLayer::GetYTranslated(), mpWindow::getZoomFactor(), mpLayer::m_font, mpLayer::m_pen, min, pPlotterLayer::offsetX, and pPlotterLayer::scaleX.
00036 {
00037
00038         int divisions=20;
00039
00040
00041         dc.SetPen( m_pen);
00042         dc.SetFont( m_font);
00043
00044
00045
00046         //data
00047         float min=(float)w.getMinScrX();
00048         float max=(float)w.getMaxScrX();
00049         float scrX=(float)w.GetScrX()-100;
00050         double scaleX=(scrX/(max-min))*w.getZoomFactor();
00051         int offsetpx=w.getOffsetPixelsX();
00052         int offsetX=w.getOffsetX();
00053
00054         //setting origins
00055
00056         //EED 14Mai2009
00057         //const int orgy   = w.GetScrY()-40;
00058 //      dc.SetDeviceOrigin(70,orgy);
00059 //      dc.SetAxisOrientation(true,true);  //EED  MacOx  ???
00060
00061         const int orgy   = 40;
00062         //dc.SetDeviceOrigin(70,orgy);
00063         dc.SetDeviceOrigin(70,0);
00064         //dc.SetAxisOrientation(true,false);
00065         double sizedc = dc.GetSize().GetY()-orgy;
00066
00067         //const int extend = w.GetScrX()-100; //JPRx
00068
00069
00070         //draw the axe
00071         dc.DrawLine(0,GetYTranslated(sizedc, 0),(max-min)*scaleX,GetYTranslated(sizedc, 0));
00072
00073         //maximum value in x
00074         int d=max-min;
00075         if(d<20)
00076                 {
00077                         int k=d/divisions;
00078                         while(k==0)
00079                                 {
00080                                         divisions--;
00081                                         k=d/divisions;
00082                                 }
00083                 }
00084         float step=(max-min)/divisions;
00085
00086         //drawing the axe with the numbers
00087         wxString s;
00088
00089
00090         //drawing the first line
00091         dc.DrawLine(0,GetYTranslated(sizedc, 0),0,GetYTranslated(sizedc, -10));
00092         s.Printf(_T("%d"),(int)(min));
00093         dc.DrawText(s,(wxCoord)0,GetYTranslated(sizedc, (wxCoord)-20));
00094
00095         for(float i=0;i<=(max);i+=step)
00096         {
00097
00098                 int p=(i-min-offsetX)*scaleX+offsetpx;
00099                 if(p>=0)
00100                 {
00101                         dc.DrawLine(p,0,p,-10);
00102                         s.Printf(_T("%d"),(int)(i));
00103                         dc.DrawText(s,(wxCoord)p,GetYTranslated(sizedc, (wxCoord)-20));
00104                 }
00105         }
00106         //drawing the last line
00107         int p=(max-min-offsetX)*scaleX+offsetpx;
00108         dc.DrawLine(p,GetYTranslated(sizedc, 0),p,GetYTranslated(sizedc, -10));
00109         s.Printf(_T("%d"),(int)(max));
00110         dc.DrawText(s,(wxCoord)p,GetYTranslated(sizedc, (wxCoord)-20));
00111
00112 }
| virtual void pPlotterLayer::Rewind | ( | ) | [inline, virtual, inherited] |
Rewind the value of node
Reimplemented in pGraphicalFunction.
Definition at line 182 of file pPlotterLayer.h.
Referenced by pPlotterLayer::drawFunction(), pPlotterLayer::drawLineToMousePoint(), and pPlotterLayer::drawPoints().
| void mpLayer::SetFont | ( | wxFont & | font | ) | [inline, inherited] |
Set layer font
- Parameters:
-
font Font, will be copied to internal class member
Definition at line 190 of file mathplot.h.
00190 { m_font = font; }
| void mpLayer::SetName | ( | wxString | name | ) | [inline, inherited] |
Set layer name
- Parameters:
-
name Name, will be copied to internal class member
Definition at line 185 of file mathplot.h.
00185 { m_name = name; }
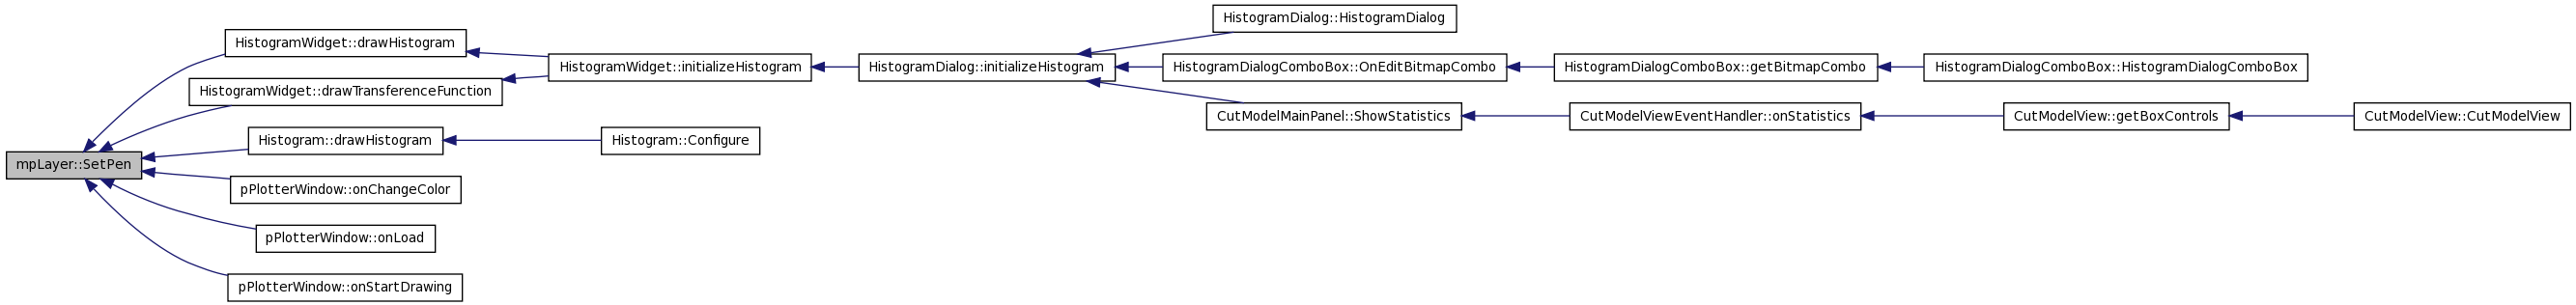
| void mpLayer::SetPen | ( | wxPen & | pen | ) | [inline, inherited] |
Set layer pen
- Parameters:
-
pen Pen, will be copied to internal class member
Definition at line 195 of file mathplot.h.
Referenced by HistogramWidget::drawHistogram(), Histogram::drawHistogram(), HistogramWidget::drawTransferenceFunction(), pPlotterWindow::onChangeColor(), pPlotterWindow::onLoad(), and pPlotterWindow::onStartDrawing().
00195 { m_pen = pen; }
| virtual void pPlotterLayer::setScreens | ( | int | scrX, | |
| int | scrY | |||
| ) | [inline, virtual, inherited] |
Set screens value
Reimplemented in pGraphicalFunction.
Definition at line 172 of file pPlotterLayer.h.
| virtual int pPlotterLayer::vGetType | ( | ) | [inline, virtual, inherited] |
Get the type of the curve 1=piecewise functio 2= smooth
Reimplemented in pGraphicalFunction.
Definition at line 138 of file pPlotterLayer.h.
Referenced by pPlotterLayer::Plot().

Member Data Documentation
int pPlotterLayer::m_flags [protected, inherited] |
Holds label alignment.
Definition at line 224 of file pPlotterLayer.h.
wxFont mpLayer::m_font [protected, inherited] |
Layer's font.
Definition at line 206 of file mathplot.h.
Referenced by pPlotterScaleY::Plot(), Plot(), mpScaleY::Plot(), mpScaleX::Plot(), mpFXY::Plot(), mpFY::Plot(), and mpFX::Plot().
wxString mpLayer::m_name [protected, inherited] |
Layer's name.
Definition at line 208 of file mathplot.h.
Referenced by mpScaleY::Plot(), mpScaleX::Plot(), mpFXY::Plot(), mpFY::Plot(), and mpFX::Plot().
wxPen mpLayer::m_pen [protected, inherited] |
Layer's pen.
Definition at line 207 of file mathplot.h.
Referenced by pPlotterScaleY::Plot(), Plot(), pPlotterLayer::Plot(), mpScaleY::Plot(), mpScaleX::Plot(), mpFXY::Plot(), mpFY::Plot(), and mpFX::Plot().
int pPlotterLayer::offsetX [protected, inherited] |
offset X
Definition at line 244 of file pPlotterLayer.h.
Referenced by pPlotterLayer::drawFunction(), pPlotterLayer::drawLineToMousePoint(), pPlotterLayer::drawPoints(), pPlotterLayer::drawSplineCurve(), Plot(), and pPlotterLayer::Plot().
int pPlotterLayer::offsetY [protected, inherited] |
offset Y
Definition at line 249 of file pPlotterLayer.h.
Referenced by pPlotterLayer::drawFunction(), pPlotterLayer::drawLineToMousePoint(), pPlotterLayer::drawPoints(), pPlotterLayer::drawSplineCurve(), pGraphicalFunction::getOffsets(), pPlotterScaleY::Plot(), and pPlotterLayer::Plot().
wxList pPlotterLayer::points [protected, inherited] |
Definition at line 231 of file pPlotterLayer.h.
Referenced by pPlotterLayer::drawFunction(), pPlotterLayer::drawLineToMousePoint(), and pPlotterLayer::drawPoints().
double pPlotterLayer::scaleX [protected, inherited] |
Definition at line 235 of file pPlotterLayer.h.
Referenced by pPlotterLayer::drawFunction(), pPlotterLayer::drawLineToMousePoint(), pPlotterLayer::drawPoints(), pPlotterLayer::drawSplineCurve(), Plot(), pPlotterLayer::Plot(), and pGraphicalFunction::setScales().
double pPlotterLayer::scaleY [protected, inherited] |
Definition at line 239 of file pPlotterLayer.h.
Referenced by pPlotterLayer::drawFunction(), pPlotterLayer::drawLineToMousePoint(), pPlotterLayer::drawPoints(), pPlotterLayer::drawSplineCurve(), pPlotterScaleY::Plot(), pPlotterLayer::Plot(), and pGraphicalFunction::setScales().
The documentation for this class was generated from the following files:
- /home/davila/Creatis/creaMaracasVisu/lib/maracasVisuLib/src/interface/wxWindows/widgets/pPlotter/pPlotterScaleX.h
- /home/davila/Creatis/creaMaracasVisu/lib/maracasVisuLib/src/interface/wxWindows/widgets/pPlotter/pPlotterScaleX.cxx