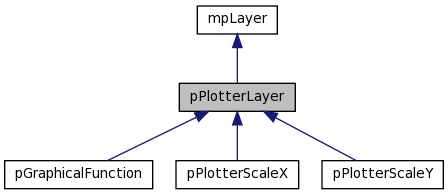
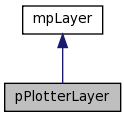
pPlotterLayer Class Reference
#include <pPlotterLayer.h>
Public Member Functions | |
| pPlotterLayer (wxString name=wxEmptyString, int flags=0x00) | |
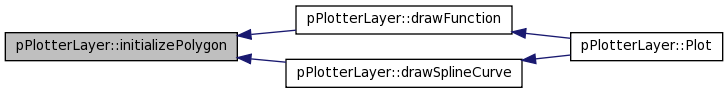
| bool | initializePolygon (wxPoint *points, double x1, double y1, double x2, double y2) |
| void | draw (wxDC &dc, mpWindow &w, double x1, double y1, double x2, double y2) |
| void | drawSplineCurve (wxDC &dc, mpWindow &w) |
| void | drawLineToMousePoint (wxDC &dc, mpWindow &w) |
| void | drawFunction (wxDC &dc, mpWindow &w) |
| void | drawPoints (wxDC &dc, mpWindow &w) |
| virtual int | getXTraslation () |
| virtual int | getmType () |
| virtual void | getMaxShowed (int &maxX, int &maxY) |
| virtual void | getMinShowed (int &minX, int &minY) |
| virtual int | getOffsetPixelsXv () |
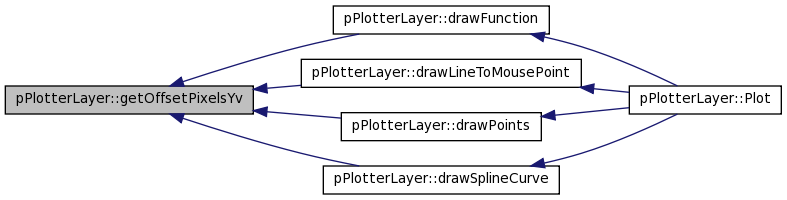
| virtual int | getOffsetPixelsYv () |
| virtual std::vector< double > | getXSpline () |
| virtual std::vector< double > | getYSpline () |
| virtual int | vGetType () |
| virtual void | getOffsets (int &offsetX, int &offSetY) |
| virtual void | getFactorZoom (float &fz) |
| virtual void | getIfActual (bool &actual) |
| virtual void | getMax (int &maxX, int &maxY) |
| virtual void | getScreens (int &scrX, int &scrY) |
| virtual void | setScreens (int scrX, int scrY) |
| virtual void | getScales (double &scaleX, double &scaleY) |
| virtual void | Rewind () |
| virtual bool | GetNextXY (double &x, double &y) |
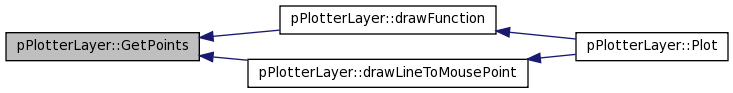
| virtual void | GetPoints (wxList &points) |
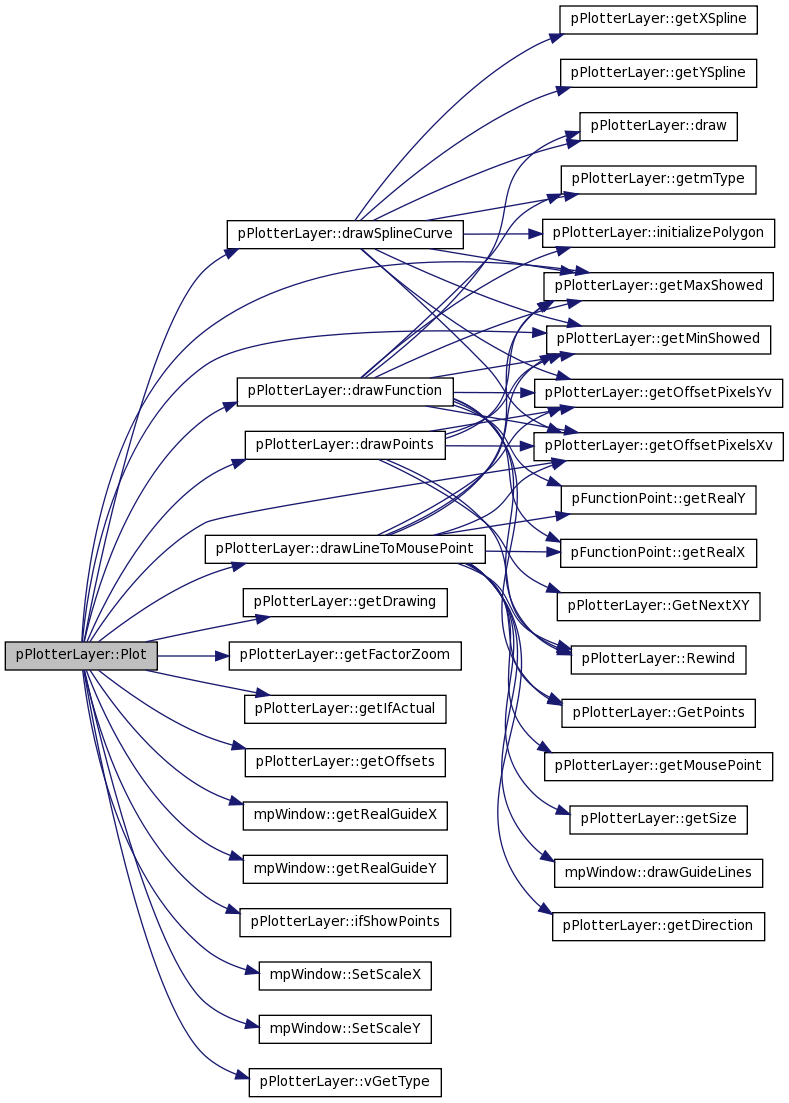
| virtual void | Plot (wxDC &dc, mpWindow &w) |
| virtual void | ifShowPoints (bool &show) |
| virtual void | getDrawing (bool &draw) |
| virtual void | getMousePoint (int &x, int &y) |
| virtual void | getDirection (bool &dir) |
| virtual void | getSize (int &size) |
| virtual bool | HasBBox () |
| virtual double | GetMinX () |
| virtual double | GetMaxX () |
| virtual double | GetMinY () |
| virtual double | GetMaxY () |
| wxString | GetName () const |
| const wxFont & | GetFont () const |
| const wxPen & | GetPen () const |
| void | SetName (wxString name) |
| void | SetFont (wxFont &font) |
| void | SetPen (wxPen &pen) |
Protected Attributes | |
| int | m_flags |
| Holds label alignment. | |
| wxList | points |
| double | scaleX |
| double | scaleY |
| int | offsetX |
| int | offsetY |
| wxFont | m_font |
| Layer's font. | |
| wxPen | m_pen |
| Layer's pen. | |
| wxString | m_name |
| Layer's name. | |
Detailed Description
Definition at line 33 of file pPlotterLayer.h.
Constructor & Destructor Documentation
| pPlotterLayer::pPlotterLayer | ( | wxString | name = wxEmptyString, |
|
| int | flags = 0x00 | |||
| ) |
- Parameters:
-
name Label flags Label alignment, pass one of mpALIGN_NE, mpALIGN_NW, mpALIGN_SW, mpALIGN_SE. name Label flags Label alignment, pass one of mpALIGN_NE, mpALIGN_NW, mpALIGN_SW, mpALIGN_SE.
Definition at line 31 of file pPlotterLayer.cxx.
00032 {
00033         SetName(name);
00034         m_flags = flags;
00035         points.DeleteContents(TRUE);
00036         offsetX=0;
00037         offsetY=0;
00038 }
Member Function Documentation
| void pPlotterLayer::draw | ( | wxDC & | dc, | |
| mpWindow & | w, | |||
| double | x1, | |||
| double | y1, | |||
| double | x2, | |||
| double | y2 | |||
| ) |
Definition at line 44 of file pPlotterLayer.cxx.
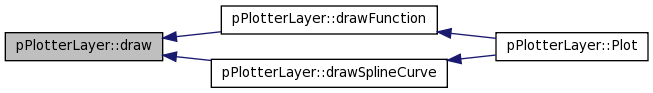
Referenced by drawFunction(), and drawSplineCurve().
00045 {
00046
00047         //intercepts
00048         float m=((float)(y2-y1))/(x2-x1);
00049         float x0=-y1/m+x1;
00050         float y0=-m*x1+y1;
00051
00052
00053         //analyzing the curve
00054
00055                 if(x1<=0 && x2>=0)
00056                 {
00057                         if(y2>=0 && y1>=0)
00058                                         dc.DrawLine(0,y0, x2,y2);
00059
00060                         else if(y2<=0 && y1>=0)
00061                         {
00062                                 if(y0>=0 && x0>=0)
00063                                         dc.DrawLine(0,y0,x0,0 );
00064                         }
00065                         else if(y2>=0 && y1<=0)
00066                         {
00067                                 if(y0>=0)
00068                                 dc.DrawLine(0,y0,x2,y2 );
00069                         }
00070
00071                 }
00072
00073                 if(x1>=0 && x2>=0)
00074                 {
00075                         if(y1>=0 && y2>=0 )
00076                                 dc.DrawLine(x1,y1, x2,y2);
00077                         else if(y1>=0 && y2<=0)
00078                                 dc.DrawLine(x1,y1,x0,0 );
00079                         else if(y1<=0 && y2>=0)
00080                                         dc.DrawLine(x0,0,x2,y2);
00081                 }
00082
00083
00084 }
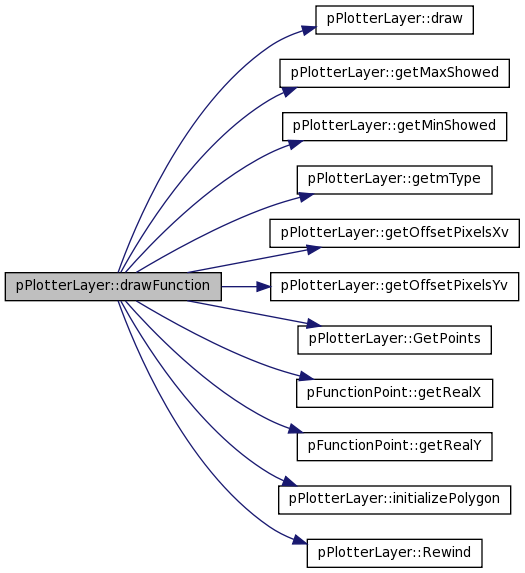
| void pPlotterLayer::drawFunction | ( | wxDC & | dc, | |
| mpWindow & | w | |||
| ) |
Draw le lines between the points of the function
Draw the lines between the points of the function
Definition at line 285 of file pPlotterLayer.cxx.
References draw(), getMaxShowed(), getMinShowed(), getmType(), getOffsetPixelsXv(), getOffsetPixelsYv(), GetPoints(), pFunctionPoint::getRealX(), pFunctionPoint::getRealY(), initializePolygon(), offsetX, offsetY, points, Rewind(), scaleX, and scaleY.
Referenced by Plot().
00286 {
00287
00288
00289         int scrwX,scrwY,offsetpx,offsetpy,maxX,minX,maxY,minY;
00290         wxPoint* ppoints=NULL;
00291
00292         /*
00293         This is the offset of every point scale to the window
00294         pixel
00295         */
00296         offsetpx=getOffsetPixelsXv();
00297         offsetpy=getOffsetPixelsYv();
00298
00299         Rewind();
00300
00301         dc.GetSize(&scrwX, &scrwY);
00302
00303         //Lines between the points
00304
00305         GetPoints(points);
00306
00307         // type of plotter
00308         int type=getmType();
00309         /***********/
00310         getMaxShowed(maxX,maxY);
00311         getMinShowed(minX,minY);
00312         /***********/
00313
00314         //traslation
00315         //int xTraslation=getXTraslation(); //JPRx
00316         wxNode* node= points.GetFirst();
00317         // int i=1;//points.GetCount()+1; //JPRx
00318         int j=2;
00319         /*
00320          Fill it if it is an histogram
00321         */
00322         wxPoint point;
00323         // pFunctionPoint* pointk; //JPRx
00324         if(type==2)
00325         {
00326                 /*
00327                 Fill the function if it represented an histogram
00328           */
00329                 ppoints=(wxPoint*)malloc(sizeof(int)*2*(points.GetCount()+2));
00330                 //initialize points
00331                 point.x=-5000;
00332                 point.y=-5000;
00333                 ppoints[0]=point;
00334                 ppoints[1]=point;
00335
00336         }
00337
00338
00339         while (node!=NULL && node->GetNext()!=NULL)
00340         {
00341                 pFunctionPoint* pointi=(pFunctionPoint*)node->GetData();
00342                                 wxNode* nextNode=node->GetNext();
00343                 pFunctionPoint* pointj=(pFunctionPoint*)nextNode->GetData();
00344
00345                 // we do the offset
00346                 int pxi=(pointi->getRealX()-minX)-offsetX;
00347                 int pyi=(pointi->getRealY()-minY)-offsetY;
00348                 int pxj=(pointj->getRealX()-minX)-offsetX;
00349                 int pyj=(pointj->getRealY()-minY)-offsetY;
00350
00351
00352                 int cxi=pxi* scaleX + offsetpx; //+ xTraslation;
00353                 int cxj=pxj* scaleX + offsetpx; //+ xTraslation;
00354                 int cyi=pyi* scaleY+ offsetpy ;
00355                 int cyj=pyj* scaleY+ offsetpy ;
00356                 //dc.DrawLine(pxi* scaleX + offsetpx,pyi* scaleY+ offsetpy, pxj* scaleX + offsetpx,pyj* scaleY+ offsetpy );
00357                 if(type!=2)
00358                         draw(dc,w,pxi* scaleX + offsetpx,pyi* scaleY+ offsetpy, pxj* scaleX + offsetpx,pyj* scaleY+ offsetpy );
00359                         //dc.DrawLine(pxi* scaleX + offsetpx,pyi* scaleY+ offsetpy, pxj* scaleX + offsetpx,pyj* scaleY+ offsetpy );
00360                 else if(type==2)
00361                 {
00362                         if(!initializePolygon(ppoints,cxi,cyi,cxj,cyj) && ((cxi<=0 && cxj>=0)||(cxi>=0 && cxj>=0)))
00363                         {
00364                                         point.x=cxj;
00365                                         point.y=cyj;
00366                                         ppoints[j]=point;
00367                                         j++;
00368
00369                         }
00370                 }
00371
00372                 node=node->GetNext();
00373
00374         }
00375         if(type==2)
00376         {
00377                 //point.x=vx.at(size-1)* scaleX + offsetpx;
00378                 point.x=ppoints[j-1].x;
00379                 point.y=0;
00380                 //ppoints[vx.size()]=point;
00381                 ppoints[j]=point;
00382                 /*
00383                 Fill the function if it represented an histogram
00384           */
00385                 //ppoints=(wxPoint*)malloc(sizeof(int)*2*(vx.size()+1));
00386                 //settings for fill
00387                 //point.x=vx.at(0)*scaleX + offsetpx;
00388                 point.x=ppoints[0].x;
00389                 point.y=0;
00390                 //ppoints[vx.size()+1]=point;
00391                 ppoints[j+1]=point;
00392
00393                 dc.SetBrush(wxBrush( wxColour(239,238,242) ,wxSOLID  ));
00394                 dc.SetPen(wxPen( wxColour(0,0,0) ,1,wxSOLID  ));
00395                 //dc.DrawPolygon(vx.size()+2,ppoints,0,0);
00396                 dc.DrawPolygon(j+2,ppoints,0,0);
00397
00398         }
00399
00400 }

| void pPlotterLayer::drawLineToMousePoint | ( | wxDC & | dc, | |
| mpWindow & | w | |||
| ) |
Draw the line between the last point of the function and the position of the mouse
Definition at line 453 of file pPlotterLayer.cxx.
References mpWindow::drawGuideLines(), getDirection(), getMaxShowed(), getMinShowed(), getMousePoint(), getOffsetPixelsXv(), getOffsetPixelsYv(), GetPoints(), pFunctionPoint::getRealX(), pFunctionPoint::getRealY(), getSize(), offsetX, offsetY, points, Rewind(), scaleX, and scaleY.
Referenced by Plot().
00454 {
00455         int x,y,sizeP,maxX,maxY,minX,minY;
00456         bool direction;
00457
00458         Rewind();
00459
00460         getMousePoint(x,y);
00461         getDirection(direction);
00462         getSize(sizeP);
00463         //Lines betwen the points
00464         GetPoints(points);
00465
00466         wxNode *node=points.GetLast();
00467         wxNode *node1=points.GetFirst();
00468
00469
00470         /*
00471         This is the offset of every point scale to the window
00472         pixel
00473         */
00474         int offsetpx = getOffsetPixelsXv();
00475         int offsetpy = getOffsetPixelsYv();
00476         /***********/
00477         getMaxShowed(maxX,maxY);
00478         getMinShowed(minX,minY);
00479         /***********/
00480         //traslation
00481 //      int xTraslation=getXTraslation(); //EED
00482
00483         if(node)
00484         {
00485                 pFunctionPoint* lastPoint=(pFunctionPoint*)node->GetData();
00486                 pFunctionPoint* firstPoint=(pFunctionPoint*)node1->GetData();
00487
00488                 //LeftDrawing
00489                 if(lastPoint->getRealX()<x && direction && sizeP >=2)
00490
00491                         dc.DrawLine((lastPoint->getRealX()-minX-offsetX)*scaleX + offsetpx,(lastPoint->getRealY()-minY-offsetY)*scaleY+ offsetpy, (x-minX)*scaleX + offsetpx, (y-minY)*scaleY + offsetpy);
00492
00493                 //right drawing
00494                 else if(firstPoint->getRealX()>x && !direction && sizeP >=2 )
00495
00496                         dc.DrawLine((firstPoint->getRealX()-minX-offsetX)*scaleX+ offsetpx,(firstPoint->getRealY()-minY-offsetY)*scaleY+ offsetpy,(x-minX)*scaleX+ offsetpx, (y-minY)*scaleY+ offsetpy);
00497
00498                 //just a point
00499                 else if(sizeP==1 )
00500                 {
00501                         dc.DrawLine((lastPoint->getRealX()-minX-offsetX)*scaleX + offsetpx,(lastPoint->getRealY()-minY-offsetY)*scaleY+ offsetpy, (x-minX)*scaleX+ offsetpx, (y-minY)*scaleY+ offsetpy);
00502                 }
00503         }
00504
00505         if( w.drawGuideLines() )
00506         {
00507                 dc.SetPen(wxPen(  wxColour(255,0,0),1,wxDOT ));
00508                 // Drawing the horizontal guide line
00509                 dc.DrawLine( 0, (y-minY)*scaleY + offsetpy, (x-minX)*scaleX + offsetpx, (y-minY)*scaleY + offsetpy);
00510                 // Drawing the vertical guide line
00511                 dc.DrawLine( (x-minX)*scaleX + offsetpx,0, (x-minX)*scaleX + offsetpx, (y-minY)*scaleY + offsetpy);
00512         }
00513 }


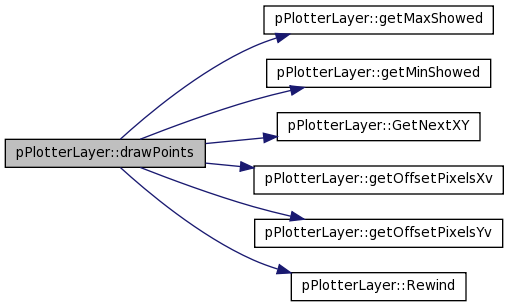
| void pPlotterLayer::drawPoints | ( | wxDC & | dc, | |
| mpWindow & | w | |||
| ) |
Draw the points of the function
Definition at line 405 of file pPlotterLayer.cxx.
References getMaxShowed(), getMinShowed(), GetNextXY(), getOffsetPixelsXv(), getOffsetPixelsYv(), MOVE, offsetX, offsetY, points, Rewind(), scaleX, and scaleY.
Referenced by Plot().
00406 {
00407
00408         Rewind();
00409         double x, y;
00410         int minX,maxX,minY,maxY;
00411
00412
00413         /*
00414         This is the offset of every point scale to the window
00415         pixel
00416         */
00417         int offsetpx=getOffsetPixelsXv();
00418         int offsetpy=getOffsetPixelsYv();
00419         //traslation
00420 //      int xTraslation=getXTraslation();  //EED
00421         /*wxPen mypen(*wxBLACK, 5, wxSOLID);
00422         dc.SetPen(mypen);*/
00423         /***********/
00424         getMaxShowed(maxX,maxY);
00425         getMinShowed(minX,minY);
00426         /***********/
00427         //we have to draw the points
00428
00429         while (GetNextXY(x, y))
00430         {
00431                 //GetNextXY(x, y);
00432                 //set the points of the polygons
00433                 wxPoint points[4];
00434                 dc.SetBrush(wxBrush( wxColour(255,0,0),wxSOLID  ));
00435                 //dc.SetPen(wxPen(wxColour(0,0,0),1,wxSOLID) );
00436                 points[0].x=((x-minX-offsetX)*scaleX + offsetpx-MOVE);
00437                 points[0].y=((y-minY-offsetY)*scaleY+ offsetpy-MOVE);
00438                 points[1].x=((x-minX-offsetX)*scaleX+ offsetpx+MOVE);
00439                 points[1].y=((y-minY-offsetY)*scaleY+ offsetpy-MOVE);
00440                 points[2].x=((x-minX-offsetX)*scaleX+ offsetpx+MOVE);
00441                 points[2].y=((y-minY-offsetY)*scaleY+ offsetpy+MOVE);
00442                 points[3].x=((x-minX-offsetX)*scaleX+ offsetpx-MOVE);
00443                 points[3].y=((y-minY-offsetY)*scaleY+ offsetpy+MOVE);
00444                 if((x-minX-offsetX)*scaleX >=0 && (y-minY-offsetY/*w.getMinScrY()*/)*scaleY>=0)
00445                 dc.DrawPolygon(4,points,0,0);
00446         }
00447 }

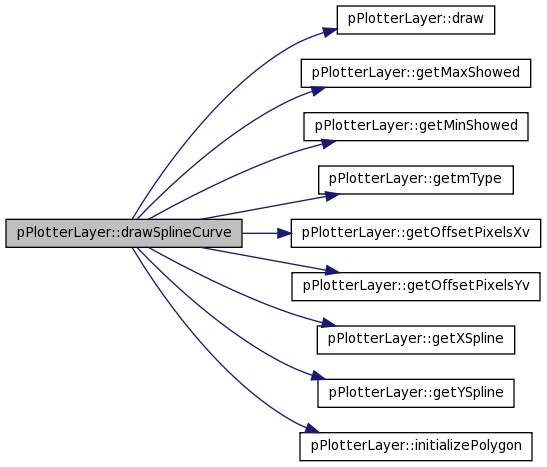
| void pPlotterLayer::drawSplineCurve | ( | wxDC & | dc, | |
| mpWindow & | w | |||
| ) |
Draw the function with th spline points
Definition at line 90 of file pPlotterLayer.cxx.
References draw(), getMaxShowed(), getMinShowed(), getmType(), getOffsetPixelsXv(), getOffsetPixelsYv(), getXSpline(), getYSpline(), initializePolygon(), offsetX, offsetY, scaleX, and scaleY.
Referenced by Plot().
00091 {
00092         std::vector<double> vx=getXSpline();
00093         std::vector<double> vy=getYSpline();
00094         wxPoint* ppoints;
00095
00096         int /*counter=0,*/ minX,maxX,minY,maxY; // JPRx
00097         /*
00098         This is the offset of every point scale to the window
00099         pixel
00100         */
00101         int offsetpx=getOffsetPixelsXv();
00102         int offsetpy=getOffsetPixelsYv();
00103
00104         // type of plotter
00105         int type=getmType();
00106
00107         wxPoint point;
00108         /***********/
00109         getMaxShowed(maxX,maxY);
00110         getMinShowed(minX,minY);
00111         /***********/
00112
00113
00114         if(type==2)
00115         {
00116          /*
00117                 Fill the function if it represented an histogram
00118           */
00119                 ppoints=(wxPoint*)malloc(sizeof(int)*2*(vx.size()+2));
00120                 //initialize points
00121                 point.x=-5000;
00122                 point.y=-5000;
00123                 ppoints[0]=point;
00124                 ppoints[1]=point;
00125         }
00126
00127         int size=vx.size();
00128         int j=2;
00129
00130         for(int i=0;(i+1)< size;i++)
00131         {
00132
00133
00134                 double cxi=(vx.at(i)-minX-offsetX)*scaleX+offsetpx;
00135                 double cyi=(vy.at(i)-minY-offsetY)*scaleY+offsetpy;
00136
00137                 double cxj=(vx.at(i+1)-minX-offsetX)*scaleX+offsetpx;
00138                 double cyj=(vy.at(i+1)-minY-offsetY)*scaleY+offsetpy;
00139
00140
00141                 if(type!=2)
00142                         draw(dc,w,cxi,cyi,cxj,cyj);
00143                 else if(type==2)
00144                 {
00145                         if(!initializePolygon(ppoints,cxi,cyi,cxj,cyj) && ((cxi<=0 && cxj>=0)||(cxi>=0 && cxj>=0)))
00146                         {
00147                                         point.x=cxj;
00148                                         point.y=cyj;
00149                                         ppoints[j]=point;
00150                                         j++;
00151
00152                         }
00153                 }
00154
00155         }
00156         if(type==2)
00157         {
00158                 //point.x=vx.at(size-1)* scaleX + offsetpx;
00159                 point.x=ppoints[j-1].x;
00160                 point.y=0;
00161                 //ppoints[vx.size()]=point;
00162                 ppoints[j]=point;
00163                 /*
00164                 Fill the function if it represented an histogram
00165           */
00166                 //ppoints=(wxPoint*)malloc(sizeof(int)*2*(vx.size()+1));
00167                 //settings for fill
00168                 //point.x=vx.at(0)*scaleX + offsetpx;
00169                 point.x=ppoints[0].x;
00170                 point.y=0;
00171                 //ppoints[vx.size()+1]=point;
00172                 ppoints[j+1]=point;
00173
00174                 dc.SetBrush(wxBrush( wxColour(239,238,242) ,wxSOLID  ));
00175                 dc.SetPen(wxPen( wxColour(0,0,0) ,1,wxSOLID  ));
00176                 //dc.DrawPolygon(vx.size()+2,ppoints,0,0);
00177                 dc.DrawPolygon(j+2,ppoints,0,0);
00178         }
00179
00180
00181 }

| virtual void pPlotterLayer::getDirection | ( | bool & | dir | ) | [inline, virtual] |
this method gets the direction of the drawing
Reimplemented in pGraphicalFunction.
Definition at line 220 of file pPlotterLayer.h.
Referenced by drawLineToMousePoint().

| virtual void pPlotterLayer::getDrawing | ( | bool & | draw | ) | [inline, virtual] |
Let us Know if the user has finished the drawing that starts before.
Reimplemented in pGraphicalFunction.
Definition at line 212 of file pPlotterLayer.h.
Referenced by Plot().

| virtual void pPlotterLayer::getFactorZoom | ( | float & | fz | ) | [inline, virtual] |
Reimplemented in pGraphicalFunction.
Definition at line 152 of file pPlotterLayer.h.
Referenced by Plot().

| const wxFont& mpLayer::GetFont | ( | ) | const [inline, inherited] |
Get font set for this layer.
- Returns:
- Font
Definition at line 175 of file mathplot.h.
00175 { return m_font; }
| virtual void pPlotterLayer::getIfActual | ( | bool & | actual | ) | [inline, virtual] |
if the function that is drawing is the actual
Reimplemented in pGraphicalFunction.
Definition at line 156 of file pPlotterLayer.h.
Referenced by Plot().

| virtual void pPlotterLayer::getMax | ( | int & | maxX, | |
| int & | maxY | |||
| ) | [inline, virtual] |
get the max of the function in x and y
Reimplemented in pGraphicalFunction.
Definition at line 162 of file pPlotterLayer.h.
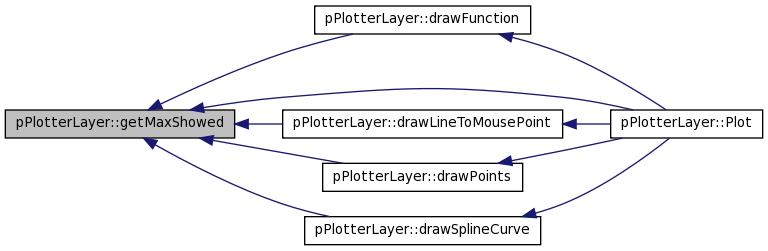
| virtual void pPlotterLayer::getMaxShowed | ( | int & | maxX, | |
| int & | maxY | |||
| ) | [inline, virtual] |
get the maxShowed of the function in x and y
Reimplemented in pGraphicalFunction.
Definition at line 92 of file pPlotterLayer.h.
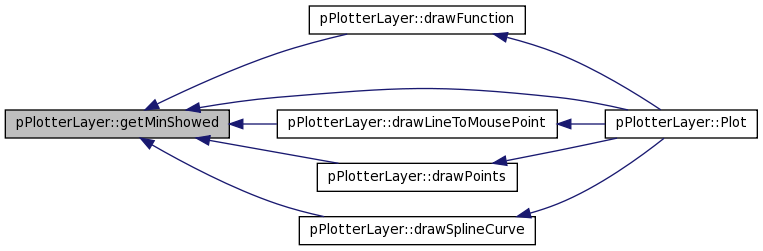
Referenced by drawFunction(), drawLineToMousePoint(), drawPoints(), drawSplineCurve(), and Plot().
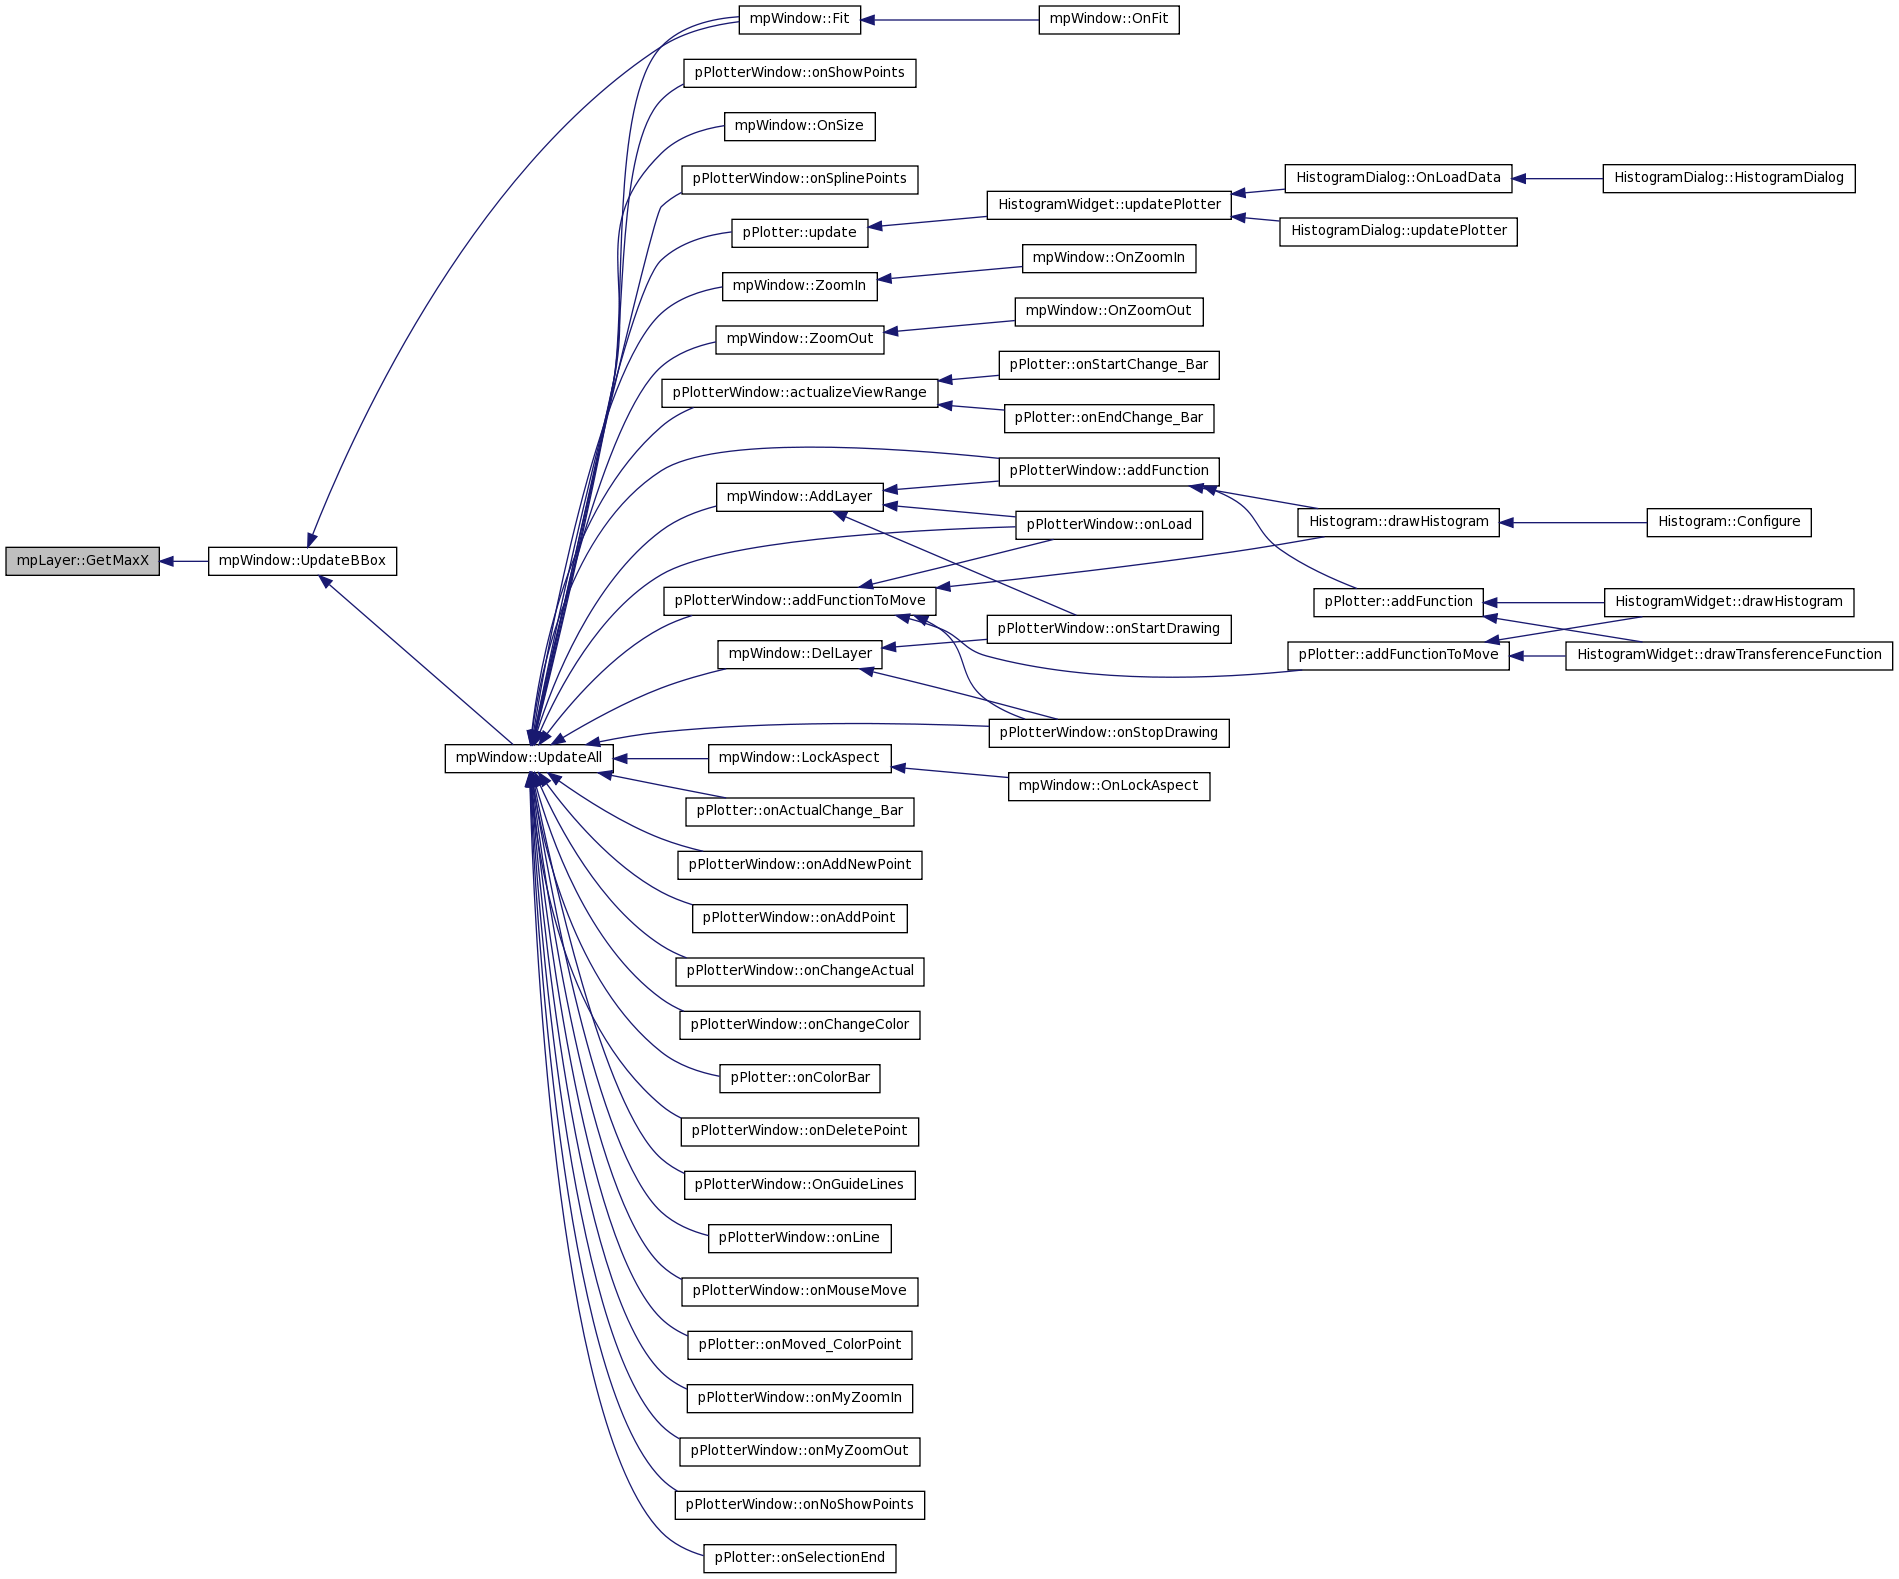
| virtual double mpLayer::GetMaxX | ( | ) | [inline, virtual, inherited] |
Get inclusive right border of bounding box.
- Returns:
- Value
Definition at line 120 of file mathplot.h.
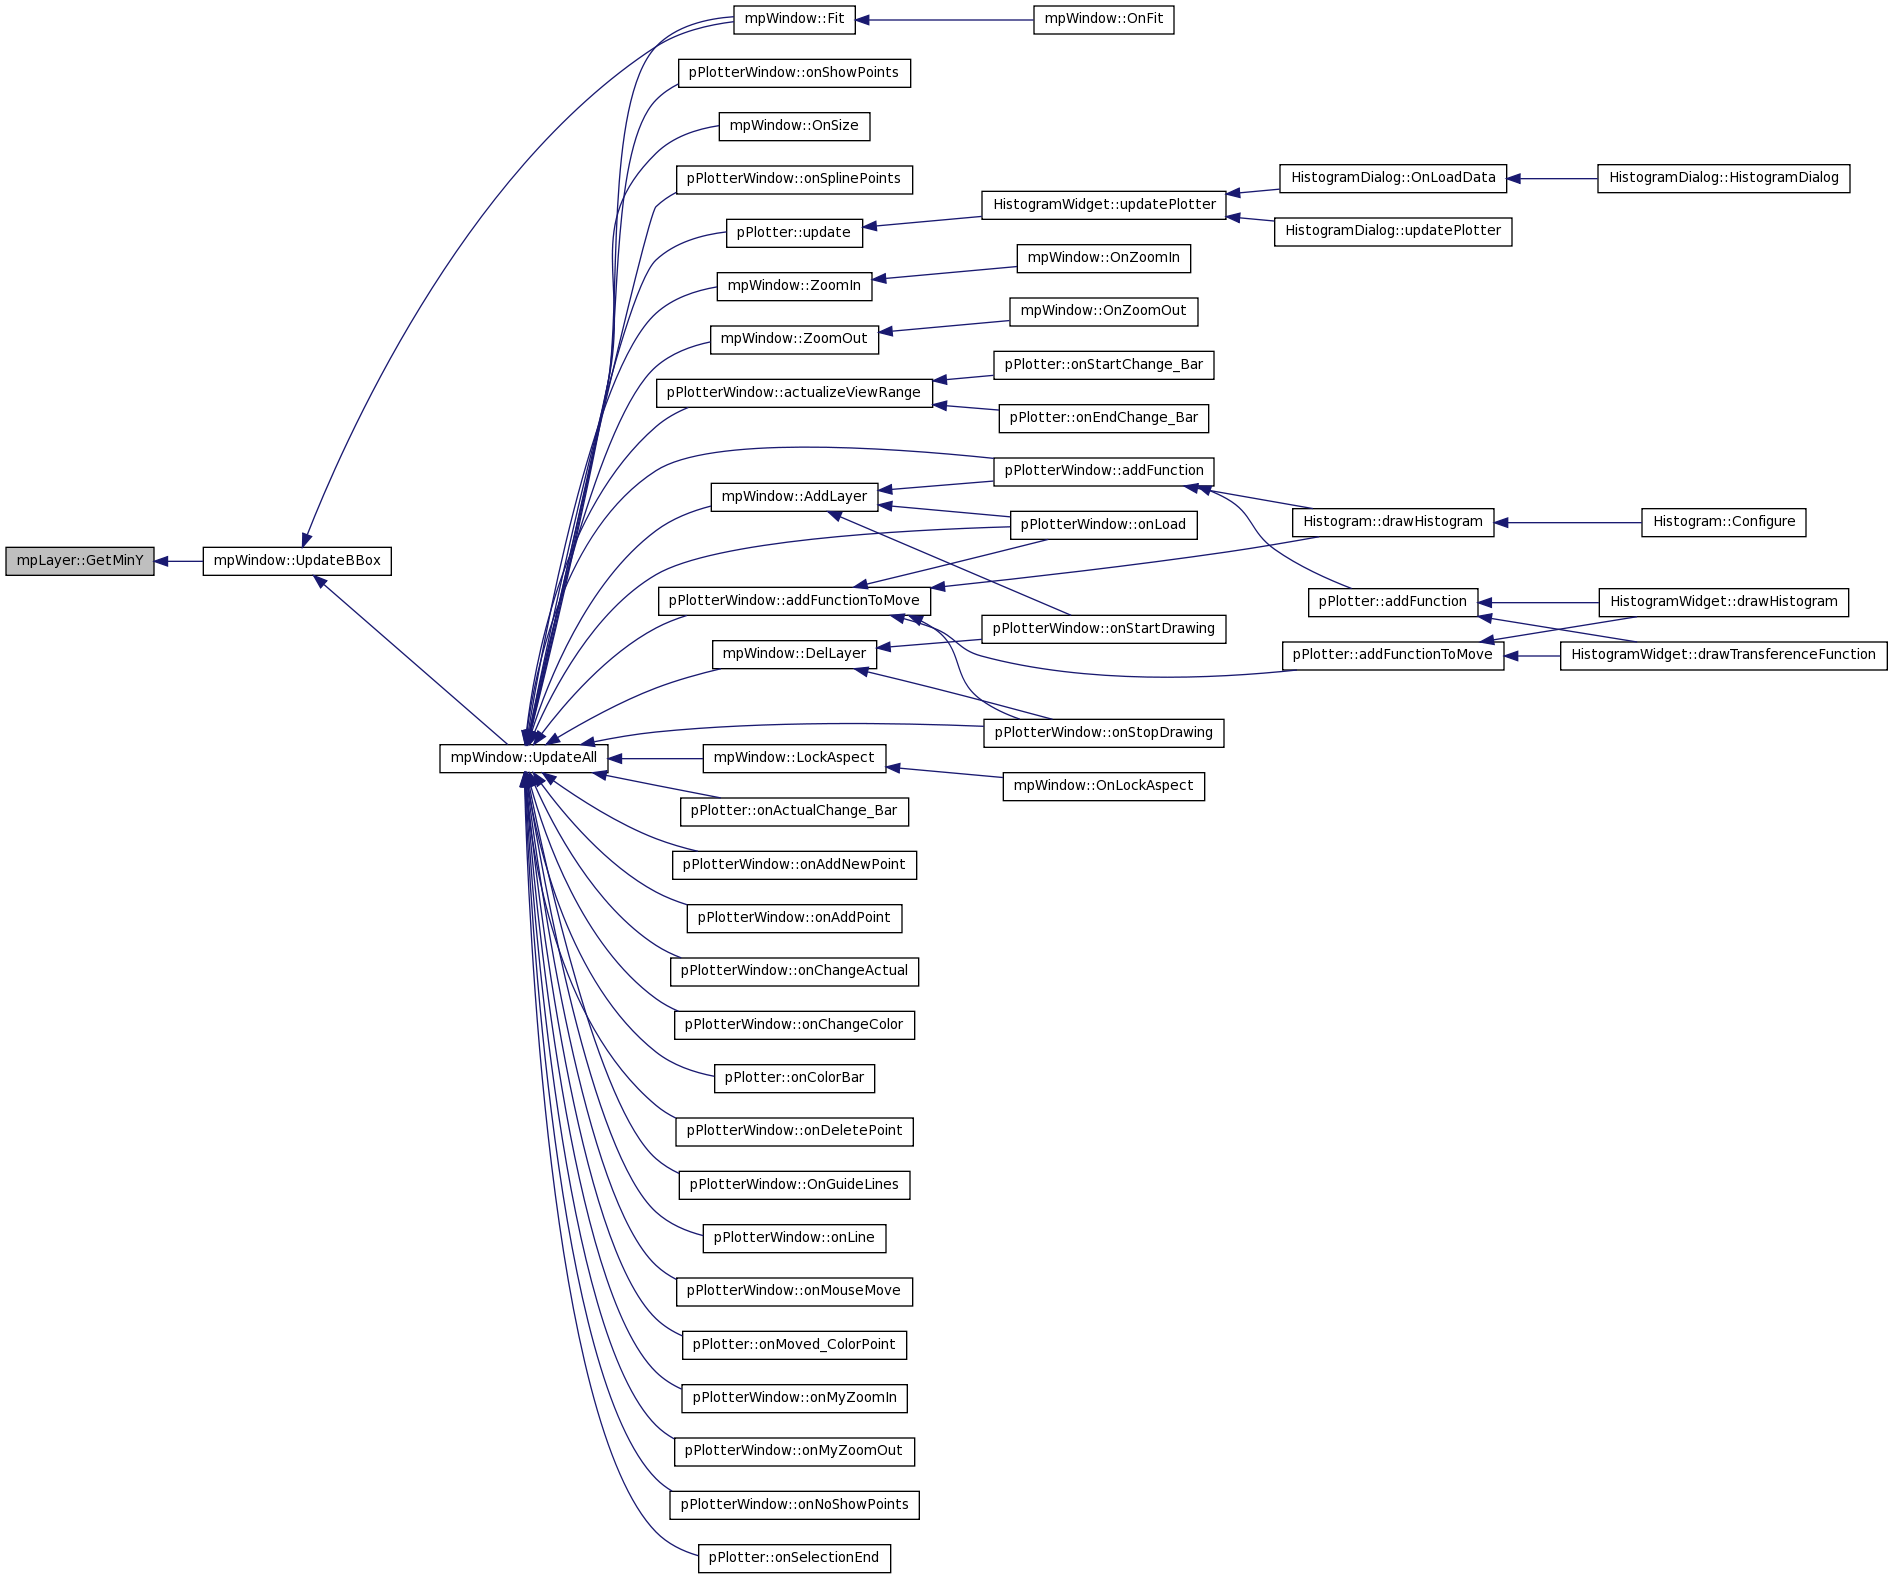
Referenced by mpWindow::UpdateBBox().
| virtual double mpLayer::GetMaxY | ( | ) | [inline, virtual, inherited] |
Get inclusive top border of bounding box.
- Returns:
- Value
Definition at line 130 of file mathplot.h.
Referenced by mpWindow::UpdateBBox().

| virtual void pPlotterLayer::getMinShowed | ( | int & | minX, | |
| int & | minY | |||
| ) | [inline, virtual] |
get the minShowed of the function in x and y
Reimplemented in pGraphicalFunction.
Definition at line 98 of file pPlotterLayer.h.
Referenced by drawFunction(), drawLineToMousePoint(), drawPoints(), drawSplineCurve(), and Plot().
| virtual double mpLayer::GetMinX | ( | ) | [inline, virtual, inherited] |
Get inclusive left border of bounding box.
- Returns:
- Value
Definition at line 115 of file mathplot.h.
Referenced by mpWindow::UpdateBBox().

| virtual double mpLayer::GetMinY | ( | ) | [inline, virtual, inherited] |
Get inclusive bottom border of bounding box.
- Returns:
- Value
Definition at line 125 of file mathplot.h.
Referenced by mpWindow::UpdateBBox().
| virtual void pPlotterLayer::getMousePoint | ( | int & | x, | |
| int & | y | |||
| ) | [inline, virtual] |
Reimplemented in pGraphicalFunction.
Definition at line 216 of file pPlotterLayer.h.
Referenced by drawLineToMousePoint().

| virtual int pPlotterLayer::getmType | ( | ) | [inline, virtual] |
Get the type of the curve 1=normal function 2=Histogram
Reimplemented in pGraphicalFunction.
Definition at line 85 of file pPlotterLayer.h.
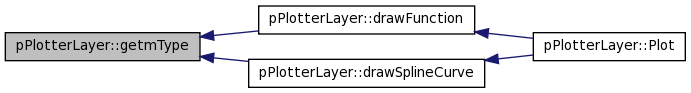
Referenced by drawFunction(), and drawSplineCurve().
| wxString mpLayer::GetName | ( | ) | const [inline, inherited] |
| virtual bool pPlotterLayer::GetNextXY | ( | double & | x, | |
| double & | y | |||
| ) | [inline, virtual] |
Get locus value for next N. Override this function in your implementation.
- Parameters:
-
x Returns X value y Returns Y value
Reimplemented in pGraphicalFunction.
Definition at line 189 of file pPlotterLayer.h.
Referenced by drawPoints().

| virtual int pPlotterLayer::getOffsetPixelsXv | ( | ) | [inline, virtual] |
Gets the x-offset of the zoom in pixels
Reimplemented in pGraphicalFunction.
Definition at line 106 of file pPlotterLayer.h.
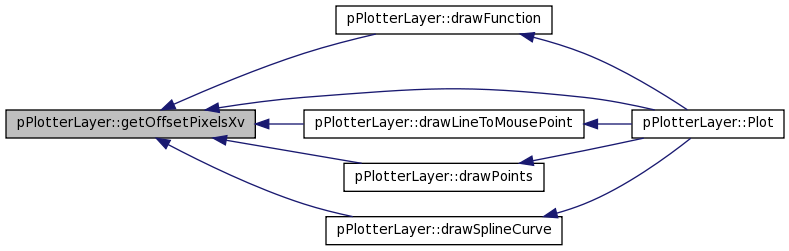
Referenced by drawFunction(), drawLineToMousePoint(), drawPoints(), drawSplineCurve(), and Plot().
| virtual int pPlotterLayer::getOffsetPixelsYv | ( | ) | [inline, virtual] |
Gets the Y-offset of the zoom in pixels
Reimplemented in pGraphicalFunction.
Definition at line 113 of file pPlotterLayer.h.
Referenced by drawFunction(), drawLineToMousePoint(), drawPoints(), and drawSplineCurve().
| virtual void pPlotterLayer::getOffsets | ( | int & | offsetX, | |
| int & | offSetY | |||
| ) | [inline, virtual] |
Get _offsetX and _offsetY
Reimplemented in pGraphicalFunction.
Definition at line 146 of file pPlotterLayer.h.
Referenced by Plot().

| const wxPen& mpLayer::GetPen | ( | ) | const [inline, inherited] |
Get pen set for this layer.
- Returns:
- Pen
Definition at line 180 of file mathplot.h.
00180 { return m_pen; }
| virtual void pPlotterLayer::GetPoints | ( | wxList & | points | ) | [inline, virtual] |
Get Point list of the funcion
- Parameters:
-
return points
Reimplemented in pGraphicalFunction.
Definition at line 195 of file pPlotterLayer.h.
Referenced by drawFunction(), and drawLineToMousePoint().
| virtual void pPlotterLayer::getScales | ( | double & | scaleX, | |
| double & | scaleY | |||
| ) | [inline, virtual] |
Let us know the scale of the function
Reimplemented in pGraphicalFunction.
Definition at line 177 of file pPlotterLayer.h.
| virtual void pPlotterLayer::getScreens | ( | int & | scrX, | |
| int & | scrY | |||
| ) | [inline, virtual] |
Get screens of the function
Reimplemented in pGraphicalFunction.
Definition at line 167 of file pPlotterLayer.h.
| virtual void pPlotterLayer::getSize | ( | int & | size | ) | [inline, virtual] |
Get the number of points of the function
Reimplemented in pGraphicalFunction.
Definition at line 224 of file pPlotterLayer.h.
Referenced by drawLineToMousePoint().

| virtual std::vector<double> pPlotterLayer::getXSpline | ( | ) | [inline, virtual] |
Reimplemented in pGraphicalFunction.
Definition at line 119 of file pPlotterLayer.h.
Referenced by drawSplineCurve().

| virtual int pPlotterLayer::getXTraslation | ( | ) | [inline, virtual] |
Get the value of the traslation in the x-axis
Reimplemented in pGraphicalFunction.
Definition at line 76 of file pPlotterLayer.h.
| virtual std::vector<double> pPlotterLayer::getYSpline | ( | ) | [inline, virtual] |
Reimplemented in pGraphicalFunction.
Definition at line 127 of file pPlotterLayer.h.
Referenced by drawSplineCurve().

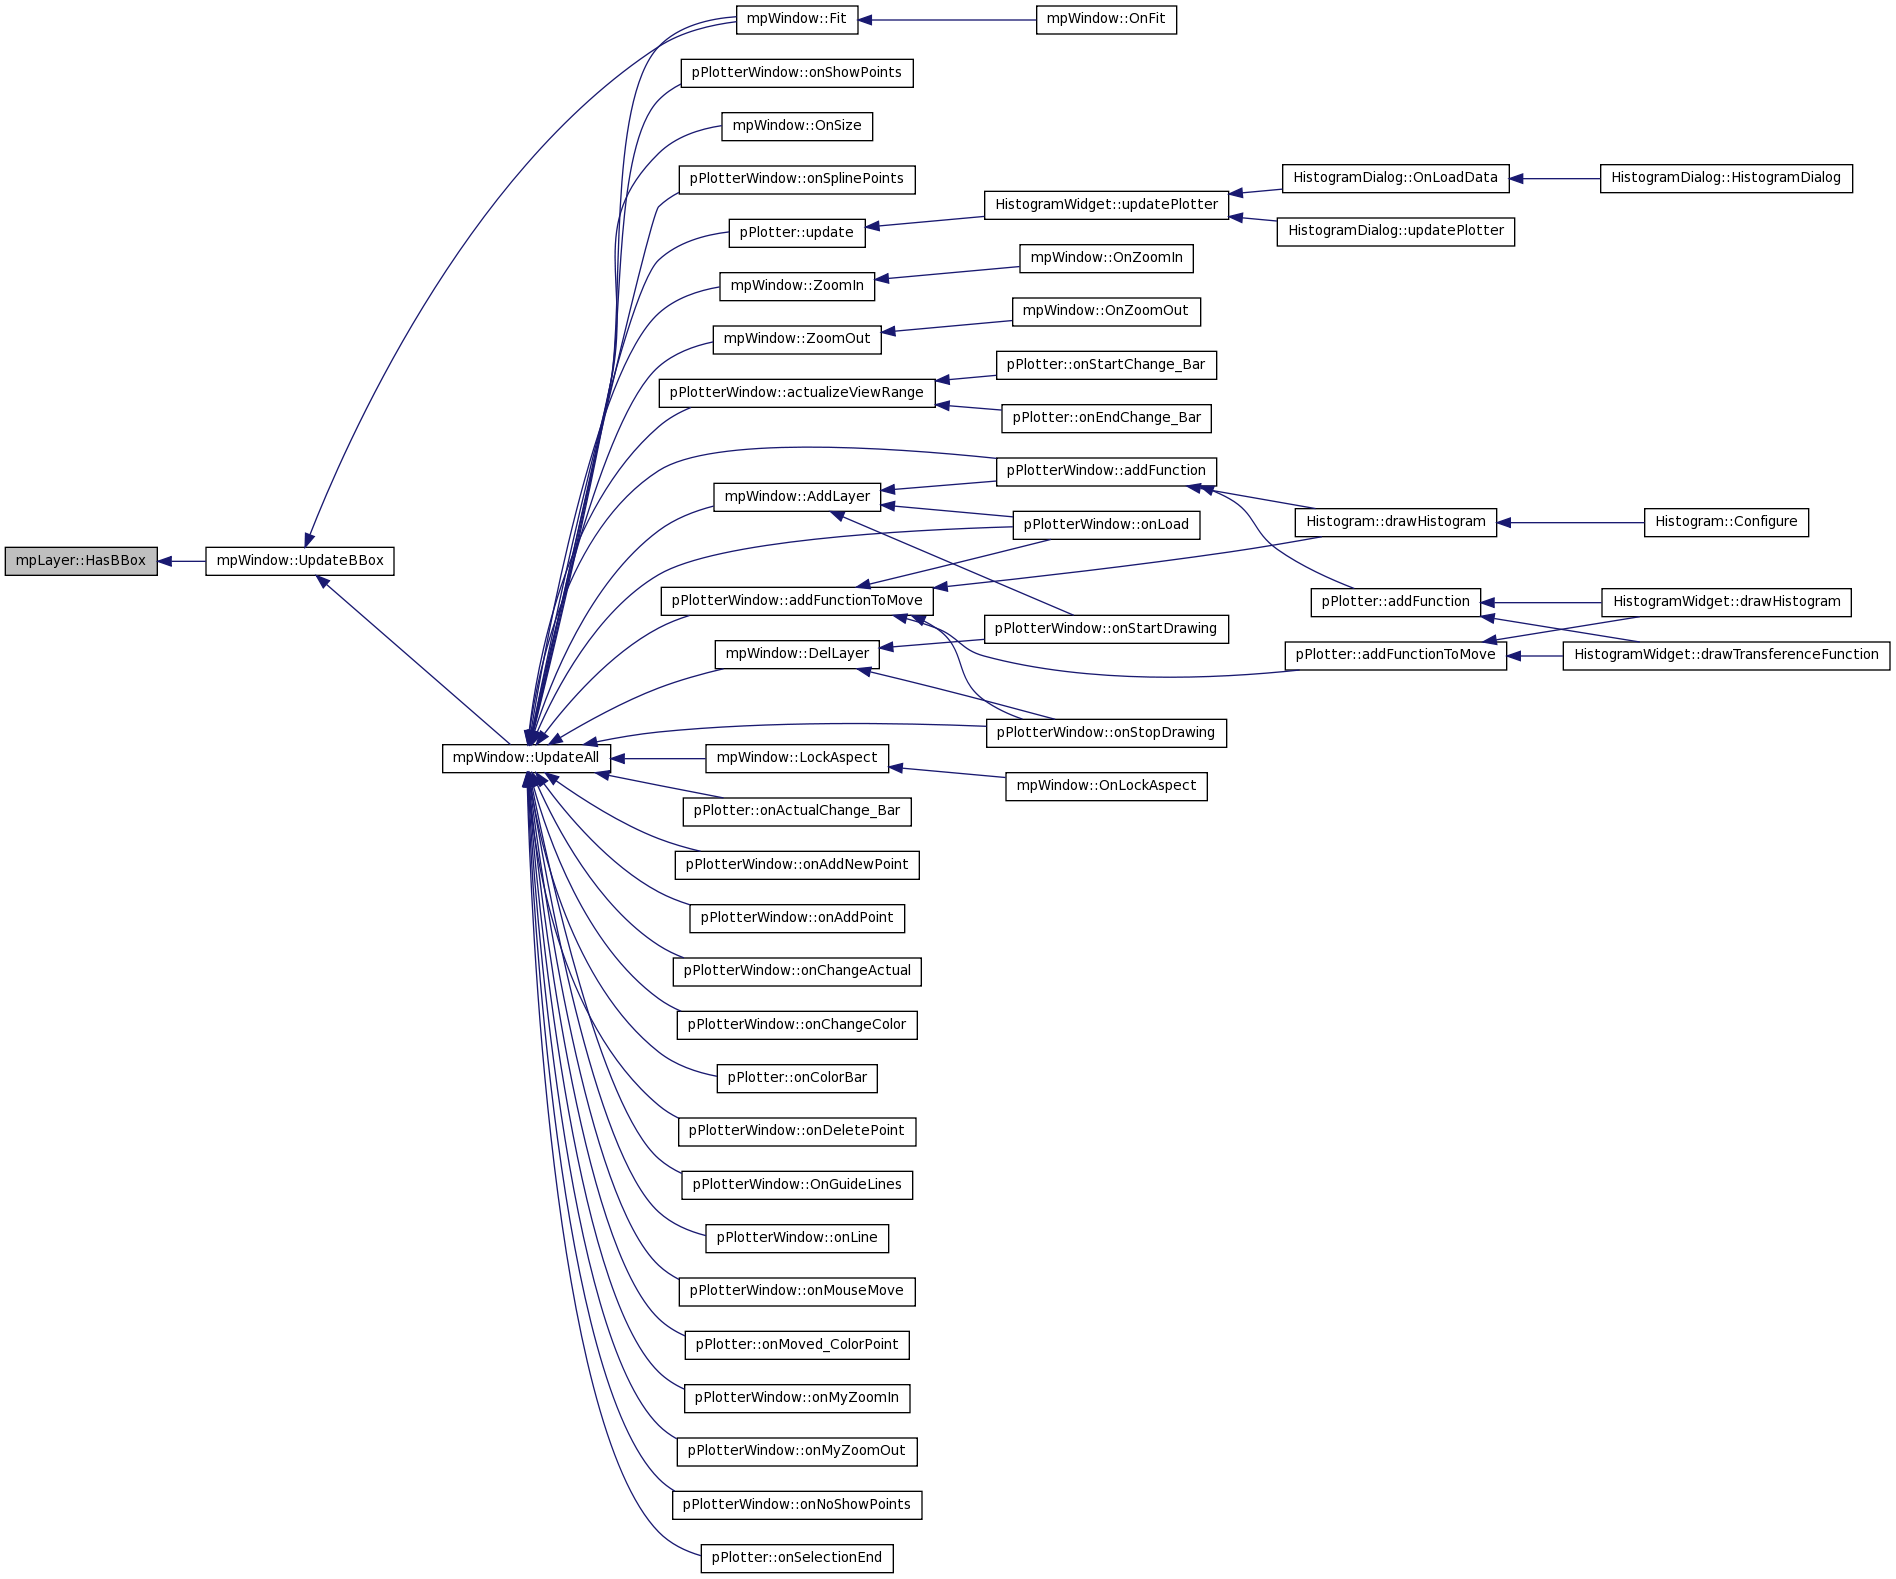
| virtual bool mpLayer::HasBBox | ( | ) | [inline, virtual, inherited] |
Check whether this layer has a bounding box. The default implementation returns TRUE. Overide and return FALSE if your mpLayer implementation should be ignored by the calculation of the global bounding box for all layers in a mpWindow.
- Return values:
-
TRUE Has bounding box FALSE Has not bounding box
Reimplemented in mpScaleX, mpScaleY, pPlotterScaleX, and pPlotterScaleY.
Definition at line 110 of file mathplot.h.
Referenced by mpWindow::UpdateBBox().
| virtual void pPlotterLayer::ifShowPoints | ( | bool & | show | ) | [inline, virtual] |
Let us Know if the user want to see the points of the function of other color than the color of the lines
Reimplemented in pGraphicalFunction.
Definition at line 206 of file pPlotterLayer.h.
Referenced by Plot().

| bool pPlotterLayer::initializePolygon | ( | wxPoint * | points, | |
| double | x1, | |||
| double | y1, | |||
| double | x2, | |||
| double | y2 | |||
| ) |
Definition at line 187 of file pPlotterLayer.cxx.
Referenced by drawFunction(), and drawSplineCurve().
00188 {
00189         bool setted=false;
00190
00191                 //intercepts
00192         float m=((float)(y2-y1))/(x2-x1);
00193         float x0=-y1/m+x1;
00194         float y0=-m*x1+y1;
00195
00196         if(points[0].x<=0&& points[1].x<=0 && points[0].y<=0&& points[1].y<=0)
00197         {
00198
00199                 //int offsetpx=getOffsetPixelsXv(); //JPRx
00200
00201                 //analyzing the curve
00202
00203                         if(x1<=0 && x2>=0)
00204                         {
00205                                 if(y2>=0 && y1>=0)
00206                                 {
00207                                                 //dc.DrawLine(0,y0, x2,y2);
00208                                                 points[0].x=0;
00209                                                 points[0].y=y0;
00210                                                 points[1].x=x2;
00211                                                 points[1].y=y2;
00212                                                 setted=true;
00213
00214                                 }
00215                                 else if(y2<=0 && y1>=0)
00216                                 {
00217                                         if(y0>=0 && x0>=0)
00218                                         {
00219                                                 //dc.DrawLine(0,y0,x0,0 );
00220                                                 points[0].x=0;
00221                                                 points[0].y=y0;
00222                                                 points[1].x=x0;
00223                                                 points[1].y=0;
00224                                                 setted=true;
00225
00226                                         }
00227
00228                                 }
00229                                 else if(y2>=0 && y1<=0)
00230                                 {
00231                                         if(y0>=0)
00232                                         {
00233                                                 //dc.DrawLine(0,y0,x2,y2 );
00234                                                 points[0].x=0;
00235                                                 points[0].y=y0;
00236                                                 points[1].x=x2;
00237                                                 points[1].y=y2;
00238                                                 setted=true;
00239                                         }
00240                                 }
00241
00242                         }
00243
00244                         if(x1>=0 && x2>=0)
00245                         {
00246                                 if(y1>=0 && y2>=0 )
00247                                 {
00248                                         //dc.DrawLine(x1,y1, x2,y2);
00249                                         points[0].x=x1;
00250                                         points[0].y=y1;
00251                                         points[1].x=x2;
00252                                         points[1].y=y2;
00253                                         setted=true;
00254                                 }
00255                                 else if(y1>=0 && y2<=0)
00256                                 {
00257                                         //dc.DrawLine(x1,y1,x0,0 );
00258                                         points[0].x=x1;
00259                                         points[0].y=y1;
00260                                         points[1].x=x0;
00261                                         points[1].y=0;
00262                                         setted=true;
00263                                 }
00264                                 else if(y1<=0 && y2>=0)
00265                                 {
00266                                         //dc.DrawLine(x0,0,x2,y2);
00267                                         points[0].x=x0;
00268                                         points[0].y=0;
00269                                         points[1].x=x2;
00270                                         points[1].y=y2;
00271                                         setted=true;
00272                                 }
00273                         }
00274                         else
00275                         return setted;
00276         }
00277         else
00278                 return setted;
00279         return setted;
00280 }
| void pPlotterLayer::Plot | ( | wxDC & | dc, | |
| mpWindow & | w | |||
| ) | [virtual] |
Layer plot handler. This implementation will plot the locus in the visible area and put a label according to the aligment specified.
Layer plot handler. This implementation will plot the locus in the visible area and put a label according to the aligment specified.
Implements mpLayer.
Reimplemented in pPlotterScaleX, and pPlotterScaleY.
Definition at line 521 of file pPlotterLayer.cxx.
References drawFunction(), drawLineToMousePoint(), drawPoints(), drawSplineCurve(), getDrawing(), getFactorZoom(), getIfActual(), getMaxShowed(), getMinShowed(), getOffsetPixelsXv(), getOffsets(), mpWindow::getRealGuideX(), mpWindow::getRealGuideY(), ifShowPoints(), mpLayer::m_pen, offsetX, offsetY, scaleX, scaleY, mpWindow::SetScaleX(), mpWindow::SetScaleY(), and vGetType().
00522 {
00523         bool show,drawing,actual;
00524         int scrwX,scrwY,maxX,maxY,minX,minY,type;
00525         float factorZoom;
00526
00527         ifShowPoints(show);
00528         getDrawing(drawing);
00529         type=vGetType();
00530
00531         dc.SetPen( m_pen);
00532
00533         /*
00534          * Managing the scale and zoom
00535          */
00536
00537         dc.GetSize(&scrwX, &scrwY);
00538         getIfActual(actual);
00539         //getMax(maxX, maxY);
00540         /***********/
00541         getMaxShowed(maxX,maxY);
00542         getMinShowed(minX,minY);
00543         /***********/
00544         getFactorZoom(factorZoom);
00545         getOffsets(offsetX,offsetY);
00546         /*
00547         maxX=w.getMaxScrX();
00548         maxY=w.getMaxScrY();
00549         minX=w.getMinScrX();
00550         minY=w.getMinScrY();
00551         */
00552         if((maxX-minX)!=0 && (maxY-minY)!=0)
00553         {
00554
00555                 scaleX=(((double)scrwX-100)/(maxX-minX))*factorZoom;
00556                 scaleY=(((double)scrwY-50)/(maxY-minY))*factorZoom;
00557
00558                 if(actual)
00559                 {
00560                         w.SetScaleX(scaleX);
00561                         w.SetScaleY(scaleY);
00562                         //w.setMinScrX(offsetX);
00563                         //w.setMinScrY(offsetY);
00564                 }
00565
00566         }
00567         /*
00568                 Managing the drawing
00569         */
00570         int orgx=70;
00571
00572
00573 //EED 14Mai2009
00574 //      int orgy=w.GetScrY()-40;
00575 //      dc.SetDeviceOrigin( orgx ,orgy);
00576 //      dc.SetAxisOrientation(true,true);
00577
00578         int orgy = 40;
00579         dc.SetDeviceOrigin( orgx ,orgy);
00580         dc.SetAxisOrientation(true,false);
00581
00582
00583
00584         //if the user dont want to see the points of the function and if he stops drawing
00585         //we have to draw the function
00586         if(!show && !drawing && type==1)
00587                 drawFunction(dc,w);
00588         else if(!show && !drawing && type==2)
00589                 drawSplineCurve(dc,w);
00590         //we just draw the point that the user just clicked
00591         else if(drawing && type==1)
00592         {
00593                 drawFunction(dc,w);
00594                 drawLineToMousePoint(dc,w);
00595                 drawPoints(dc,w);
00596         }
00597         else if(drawing && type==1)
00598         {
00599                 drawSplineCurve(dc,w);
00600                 drawLineToMousePoint(dc,w);
00601                 drawPoints(dc,w);
00602         }
00603         else if(show && type==1)
00604         {
00605                 drawFunction(dc,w);
00606                 drawPoints(dc,w);
00607         }
00608         else if(show && type==2)
00609         {
00610                 drawSplineCurve(dc,w);
00611                 drawPoints(dc,w);
00612         }
00613
00614         // Drawing the guides according to real values entered according to the integrated interaction (IS NOT WORKING!!!)
00615         if ( actual )
00616         {
00617                 dc.SetPen(wxPen(  wxColour(255,0,0),1,wxDOT ));
00618                 int offsetpx = getOffsetPixelsXv();
00619 //              int offsetpy = getOffsetPixelsYv();  //EED
00620
00621                 int realX_guide = w.getRealGuideX();
00622                 if( realX_guide!=-1 )
00623                 {
00624                 dc.DrawLine( (realX_guide/*-w.getMinScrX()*/-offsetX)*scaleX + offsetpx, 0, (realX_guide/*-w.getMinScrX()*/-offsetX)*scaleX + offsetpx, scrwY);
00625                 }
00626
00627                 int realY_guide = w.getRealGuideY();
00628                 if( realY_guide!=-1 )
00629                 {
00630                         dc.DrawLine( 0,(realY_guide/*-w.getMinScrY()*/-offsetX)*scaleX + offsetpx, scrwX, (realY_guide/*-w.getMinScrY()*/-offsetX)*scaleX + offsetpx);
00631                 }
00632         }
00633
00634 }
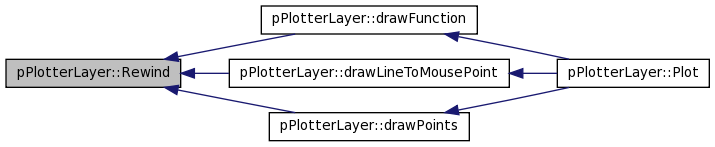
| virtual void pPlotterLayer::Rewind | ( | ) | [inline, virtual] |
Rewind the value of node
Reimplemented in pGraphicalFunction.
Definition at line 182 of file pPlotterLayer.h.
Referenced by drawFunction(), drawLineToMousePoint(), and drawPoints().
| void mpLayer::SetFont | ( | wxFont & | font | ) | [inline, inherited] |
Set layer font
- Parameters:
-
font Font, will be copied to internal class member
Definition at line 190 of file mathplot.h.
00190 { m_font = font; }
| void mpLayer::SetName | ( | wxString | name | ) | [inline, inherited] |
Set layer name
- Parameters:
-
name Name, will be copied to internal class member
Definition at line 185 of file mathplot.h.
00185 { m_name = name; }
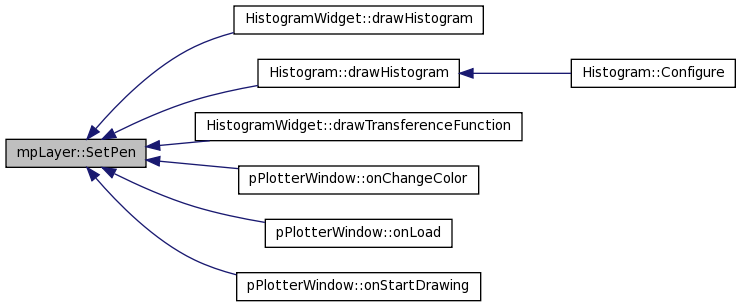
| void mpLayer::SetPen | ( | wxPen & | pen | ) | [inline, inherited] |
Set layer pen
- Parameters:
-
pen Pen, will be copied to internal class member
Definition at line 195 of file mathplot.h.
Referenced by HistogramWidget::drawHistogram(), Histogram::drawHistogram(), HistogramWidget::drawTransferenceFunction(), pPlotterWindow::onChangeColor(), pPlotterWindow::onLoad(), and pPlotterWindow::onStartDrawing().
00195 { m_pen = pen; }
| virtual void pPlotterLayer::setScreens | ( | int | scrX, | |
| int | scrY | |||
| ) | [inline, virtual] |
Set screens value
Reimplemented in pGraphicalFunction.
Definition at line 172 of file pPlotterLayer.h.
| virtual int pPlotterLayer::vGetType | ( | ) | [inline, virtual] |
Get the type of the curve 1=piecewise functio 2= smooth
Reimplemented in pGraphicalFunction.
Definition at line 138 of file pPlotterLayer.h.
Referenced by Plot().

Member Data Documentation
int pPlotterLayer::m_flags [protected] |
wxFont mpLayer::m_font [protected, inherited] |
Layer's font.
Definition at line 198 of file mathplot.h.
Referenced by pPlotterScaleY::Plot(), pPlotterScaleX::Plot(), mpScaleY::Plot(), mpScaleX::Plot(), mpFXY::Plot(), mpFY::Plot(), and mpFX::Plot().
wxString mpLayer::m_name [protected, inherited] |
Layer's name.
Definition at line 200 of file mathplot.h.
Referenced by mpScaleY::Plot(), mpScaleX::Plot(), mpFXY::Plot(), mpFY::Plot(), and mpFX::Plot().
wxPen mpLayer::m_pen [protected, inherited] |
Layer's pen.
Definition at line 199 of file mathplot.h.
Referenced by pPlotterScaleY::Plot(), pPlotterScaleX::Plot(), Plot(), mpScaleY::Plot(), mpScaleX::Plot(), mpFXY::Plot(), mpFY::Plot(), and mpFX::Plot().
int pPlotterLayer::offsetX [protected] |
offset X
Definition at line 244 of file pPlotterLayer.h.
Referenced by drawFunction(), drawLineToMousePoint(), drawPoints(), drawSplineCurve(), pPlotterScaleX::Plot(), and Plot().
int pPlotterLayer::offsetY [protected] |
offset Y
Definition at line 249 of file pPlotterLayer.h.
Referenced by drawFunction(), drawLineToMousePoint(), drawPoints(), drawSplineCurve(), pGraphicalFunction::getOffsets(), pPlotterScaleY::Plot(), and Plot().
wxList pPlotterLayer::points [protected] |
Definition at line 231 of file pPlotterLayer.h.
Referenced by drawFunction(), drawLineToMousePoint(), and drawPoints().
double pPlotterLayer::scaleX [protected] |
Definition at line 235 of file pPlotterLayer.h.
Referenced by drawFunction(), drawLineToMousePoint(), drawPoints(), drawSplineCurve(), pPlotterScaleX::Plot(), Plot(), and pGraphicalFunction::setScales().
double pPlotterLayer::scaleY [protected] |
Definition at line 239 of file pPlotterLayer.h.
Referenced by drawFunction(), drawLineToMousePoint(), drawPoints(), drawSplineCurve(), pPlotterScaleY::Plot(), Plot(), and pGraphicalFunction::setScales().
The documentation for this class was generated from the following files:
- /Users/davila/Creatis/creaMaracasVisu/lib/maracasVisuLib/src/interface/wxWindows/widgets/pPlotter/pPlotterLayer.h
- /Users/davila/Creatis/creaMaracasVisu/lib/maracasVisuLib/src/interface/wxWindows/widgets/pPlotter/pPlotterLayer.cxx