pPlotter Class Reference
#include <pPlotter.h>
Public Member Functions | |
| pPlotter (wxWindow *parent, int nWidth, int nHeight) | |
| ~pPlotter () | |
| void | onChangeFunction (wxCommandEvent &event) |
| void | onAddedPoint_Plotter (wxCommandEvent &event) |
| void | onRemovedPoint_Plotter (wxCommandEvent &event) |
| void | onMovePoint_Plotter (wxCommandEvent &event) |
| void | onGuideLines (wxCommandEvent &event) |
| void | onAdded_ColorPoint (wxCommandEvent &event) |
| void | onRemoved_ColorPoint (wxCommandEvent &event) |
| void | onMoved_ColorPoint (wxCommandEvent &event) |
| void | onChanged_ColorPoint (wxCommandEvent &event) |
| void | onColorBar (wxCommandEvent &event) |
| void | onBarrange (wxCommandEvent &event) |
| void | onActualChange_Bar (wxCommandEvent &event) |
| void | onStartChange_Bar (wxCommandEvent &event) |
| void | onEndChange_Bar (wxCommandEvent &event) |
| void | onSelectionEnd (wxCommandEvent &event) |
| void | onMovedBar (wxCommandEvent &event) |
| void | sendTMessage (wxString theText) |
| wxWindow * | initialize (wxWindow *parent) |
| void | setTextMessage (wxString nMessage) |
| wxString | getTextMessage () |
| pGraphicalFunction * | getFunctionForVectors (double *vectorX, int sizeX, double *vectorY, int sizeY) |
| int | addFunction (pGraphicalFunction *function) |
| void | setType (int t) |
| pGraphicalFunction * | getFunction (int index) |
| void | OnSize (wxSizeEvent &WXUNUSED(event)) |
| void | moveFunctions (float porcentageMinX, float porcentageMaxX) |
| int | addFunctionToMove (pGraphicalFunction *function) |
| void | setAll () |
| int | getColorPointsSize () |
| void | getBarColorDataAt (int index, double &x, int &red, int &green, int &blue) |
| bool | addColorPoint (int x, int red, int green, int blue) |
| void | eraseColorPoints () |
| float | getMaxShowedPorcentage () |
| float | getMinShowedPorcentage () |
| float | getActualShowedPorcentage () |
| void | setActual (pGraphicalFunction *nActual) |
| void | update () |
| void | setPopUpMenu (bool startD, bool stopD, bool smooth, bool line, bool zoomIn, bool zoomOut, bool showPoints, bool noShowPoints, bool changeColor, bool addP, bool delPoint, bool load, bool save) |
| void | GetValuesPointsFunction (std::vector< double > &greylevel, std::vector< double > &value, int histogramsize) |
| void | GetValuesColorPointsFunction (std::vector< double > &greylevel, std::vector< double > &red, std::vector< double > &green, std::vector< double > &blue) |
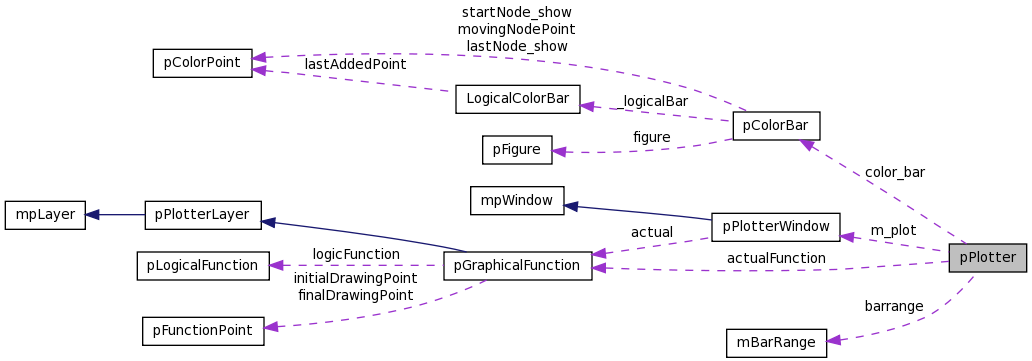
Private Attributes | |
| pPlotterWindow * | m_plot |
| pColorBar * | color_bar |
| mBarRange * | barrange |
| pGraphicalFunction * | actualFunction |
| wxString | text |
Detailed Description
Definition at line 47 of file pPlotter.h.
Constructor & Destructor Documentation
| pPlotter::pPlotter | ( | wxWindow * | parent, | |
| int | nWidth, | |||
| int | nHeight | |||
| ) |
Definition at line 98 of file pPlotter.cxx.
References mpWindow::getMaxScrX().
00099         :wxPanel(parent,-1,wxDefaultPosition,wxDefaultSize,wxTAB_TRAVERSAL)
00100         {
00101                 SetBackgroundColour(wxColour(255,255,255));
00102                 m_plot = new pPlotterWindow( this, -1, wxPoint(0,0), wxSize(nWidth,nHeight), wxSUNKEN_BORDER );
00103                 actualFunction =NULL;
00104                 // Adding the axis layers to the plotter
00105                 m_plot->AddLayer( new pPlotterScaleX() );
00106                 m_plot->AddLayer( new pPlotterScaleY() );
00107
00108                 // Creating the log window
00109         /*
00110
00111                 m_log = new wxTextCtrl( panel, -1, wxT("This is the log window.\n"), wxPoint(0,0), wxSize(400,100), wxTE_MULTILINE );
00112                 // Sharing the log window of the application with the plotter widget
00113                 m_plot->setmLog(m_log);
00114
00115                 */
00116
00117
00118                 // Creating a function for the plotter with given points x-vector and y-vector
00119
00120                 /*
00121                 double vectX_F1 [] = { 0, 20, 50, 80, 100, 115, 120, 210, 220,250 };
00122
00123
00124 //              double vectX_F1 [] = { 0, 20, 50, 80, 100, 115, 120, 210, 220,250 };
00125
00126                 double vectY_F1 [] = { 0, 40, 70, 100, 200, 100, 40, 170, 0, 50  };
00127                 pGraphicalFunction * f1 = m_plot ->getFunctionForVectors( vectX_F1, 10, vectY_F1, 10 );
00128                 // Including and drawing the created function in the plotter
00129                 if (f1)
00130                 {
00131                         m_plot->addFunction( f1 );
00132                         m_plot->addFunctionToMove(f1);
00133                         //m_plot->addFunctionToMove(f1);
00134                         wxPen mypen1(*wxBLUE, 2, wxDOT_DASH );
00135                         mypen1.SetWidth(2);
00136                         f1->SetPen( mypen1 );
00137                 }
00138                 */
00139
00140                 //=================== lines to sychronyze the bars width with the drawed plotter--------------------------
00141
00142                 mpWindow* mplotWindow = ((mpWindow*)m_plot);
00143                 float minReal_X = 0; //(float)mplotWindow->getMinScrX();
00144                 float maxReal_X =(float)mplotWindow->getMaxScrX();
00145                 //float scrX=(float)mplotWindow->GetScrX()-100; // JPRx
00146                 //double scaleX=(scrX/(maxReal_X))* (mplotWindow->getZoomFactor()); // JPRx
00147
00148                 // Creating the color bar with values according to the plotter added widget
00149                 color_bar = new pColorBar(this, (m_plot->GetSize()).GetWidth(),40, true);
00150                 color_bar -> setRepresentedValues ((int)minReal_X, (int)maxReal_X);
00151                 color_bar -> setDeviceBlitStart (70,0);
00152                 color_bar -> setVisibleRange ((int)minReal_X,(int) maxReal_X);
00153                 color_bar -> setDeviceEndMargin (50);
00154
00155
00156                 // Creating the min-max barrange bar with values according to the plotter added widget
00157                 barrange = new mBarRange(this, (m_plot->GetSize()).GetWidth(),30);
00158                 barrange -> setVisibleLabels (false);
00159                 barrange -> setRepresentedValues (minReal_X, maxReal_X);
00160                 barrange -> setDeviceBlitStart (70,0);
00161                 barrange -> setDeviceEndMargin (50);
00162
00163                 // Adding the components to the sizer
00164                 /*
00165                 if(m_plot->getActualFunction())
00166                         setAll();
00167                 */
00168                 wxBoxSizer *sizer = new wxBoxSizer(wxVERTICAL);
00169                 sizer->Add( m_plot, 4, wxEXPAND);
00170                 sizer->Add( color_bar,0, wxEXPAND );
00171                 sizer->Add( barrange, 0, wxEXPAND );
00172
00173                 // sizer->Add( m_log, 0, wxEXPAND);
00174
00175                 // Stablishing the layout and sizer of the panel
00176                 /*panel->*/SetAutoLayout(true);
00177                 /*panel->*/SetSizer(sizer);
00178                 /*panel->*/Layout();
00179
00180                 /*panel->*/Refresh();
00181         }

| pPlotter::~pPlotter | ( | ) |
Definition at line 184 of file pPlotter.cxx.
Member Function Documentation
| bool pPlotter::addColorPoint | ( | int | x, | |
| int | red, | |||
| int | green, | |||
| int | blue | |||
| ) |
Definition at line 630 of file pPlotter.cxx.
References pColorBar::addColorPoint(), and color_bar.
Referenced by HistogramWidget::addColorPoint().
00631         {
00632                 wxColour color= wxColour(red,green,blue);
00633                 return color_bar->addColorPoint((double)x, color);
00634         }


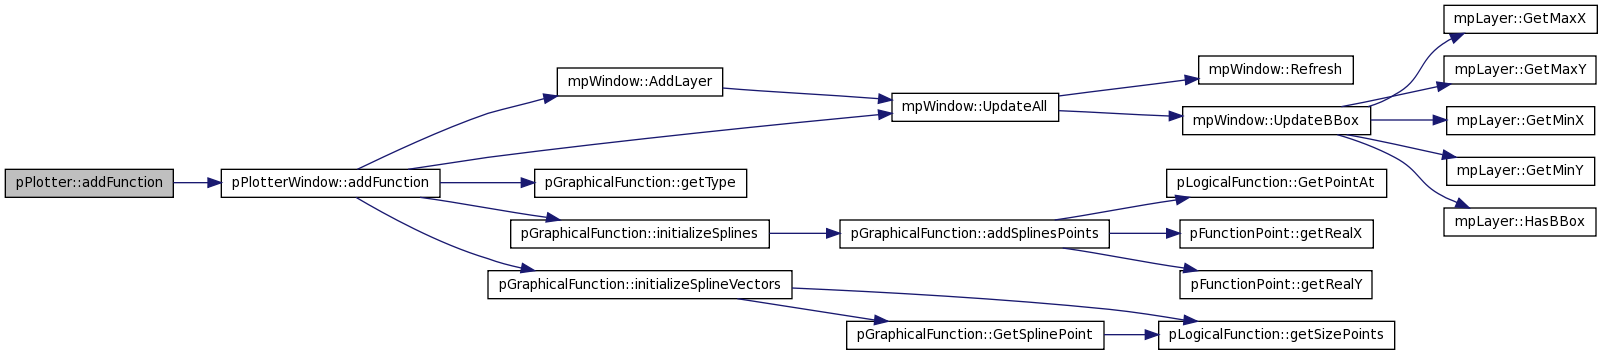
| int pPlotter::addFunction | ( | pGraphicalFunction * | function | ) |
Add a function to the plotter when the function doesnt come from window
Definition at line 550 of file pPlotter.cxx.
References pPlotterWindow::addFunction(), and m_plot.
Referenced by HistogramWidget::drawHistogram(), and HistogramWidget::drawTransferenceFunction().
00551         {
00552                 return m_plot->addFunction(function);
00553         }

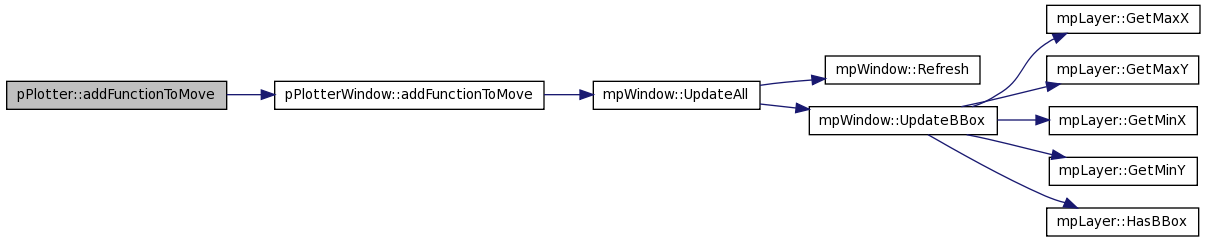
| int pPlotter::addFunctionToMove | ( | pGraphicalFunction * | function | ) |
Definition at line 578 of file pPlotter.cxx.
References pPlotterWindow::addFunctionToMove(), and m_plot.
Referenced by HistogramWidget::drawHistogram(), and HistogramWidget::drawTransferenceFunction().
00579         {
00580                 return m_plot->addFunctionToMove(function);
00581         }

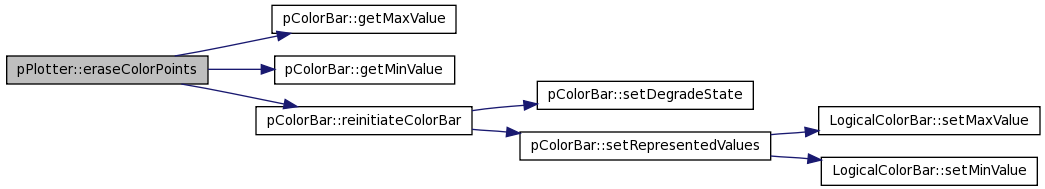
| void pPlotter::eraseColorPoints | ( | ) |
Definition at line 635 of file pPlotter.cxx.
References color_bar, pColorBar::getMaxValue(), pColorBar::getMinValue(), min, and pColorBar::reinitiateColorBar().
Referenced by HistogramWidget::eraseColorPoints().
00636         {
00637                 int min=(int)color_bar->getMinValue();
00638                 int max=(int)color_bar->getMaxValue();
00639                 color_bar->reinitiateColorBar(min,max);
00640         }

| float pPlotter::getActualShowedPorcentage | ( | ) |
Definition at line 653 of file pPlotter.cxx.
References barrange, and mBarRange::getActualShowPorcentage().
00654         {
00655                 return barrange->getActualShowPorcentage();
00656         }

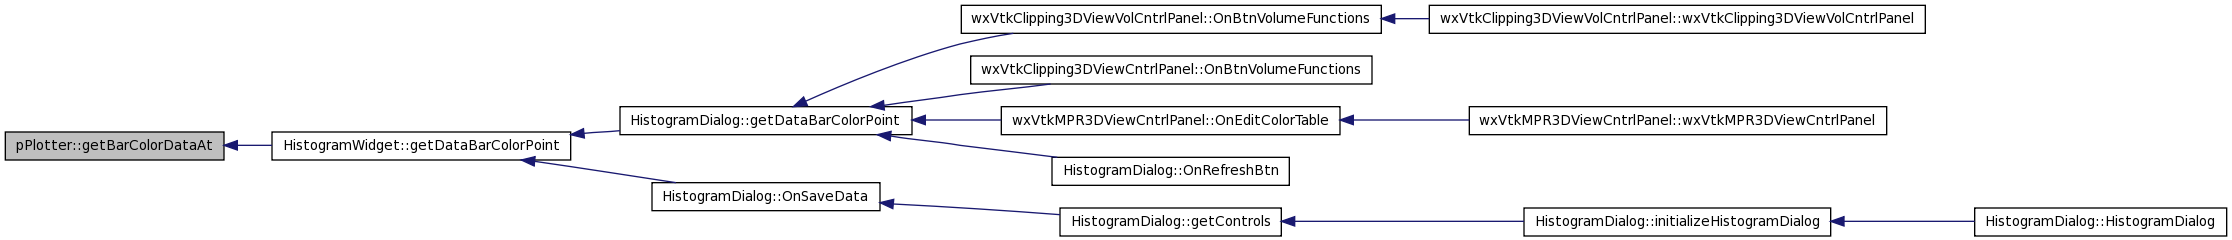
| void pPlotter::getBarColorDataAt | ( | int | index, | |
| double & | x, | |||
| int & | red, | |||
| int & | green, | |||
| int & | blue | |||
| ) |
Definition at line 621 of file pPlotter.cxx.
References color_bar, and pColorBar::getDataAt().
Referenced by HistogramWidget::getDataBarColorPoint().

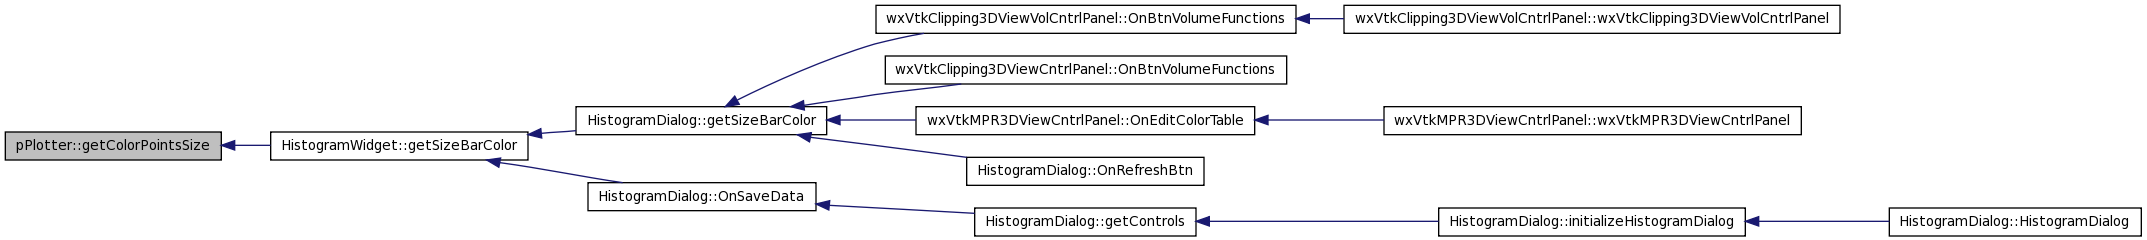
| int pPlotter::getColorPointsSize | ( | ) |
Returns the number of points that the bar color has
Definition at line 613 of file pPlotter.cxx.
References color_bar, and pColorBar::getColorPointsSize().
Referenced by HistogramWidget::getSizeBarColor().
00614         {
00615                 return color_bar->getColorPointsSize();
00616         }

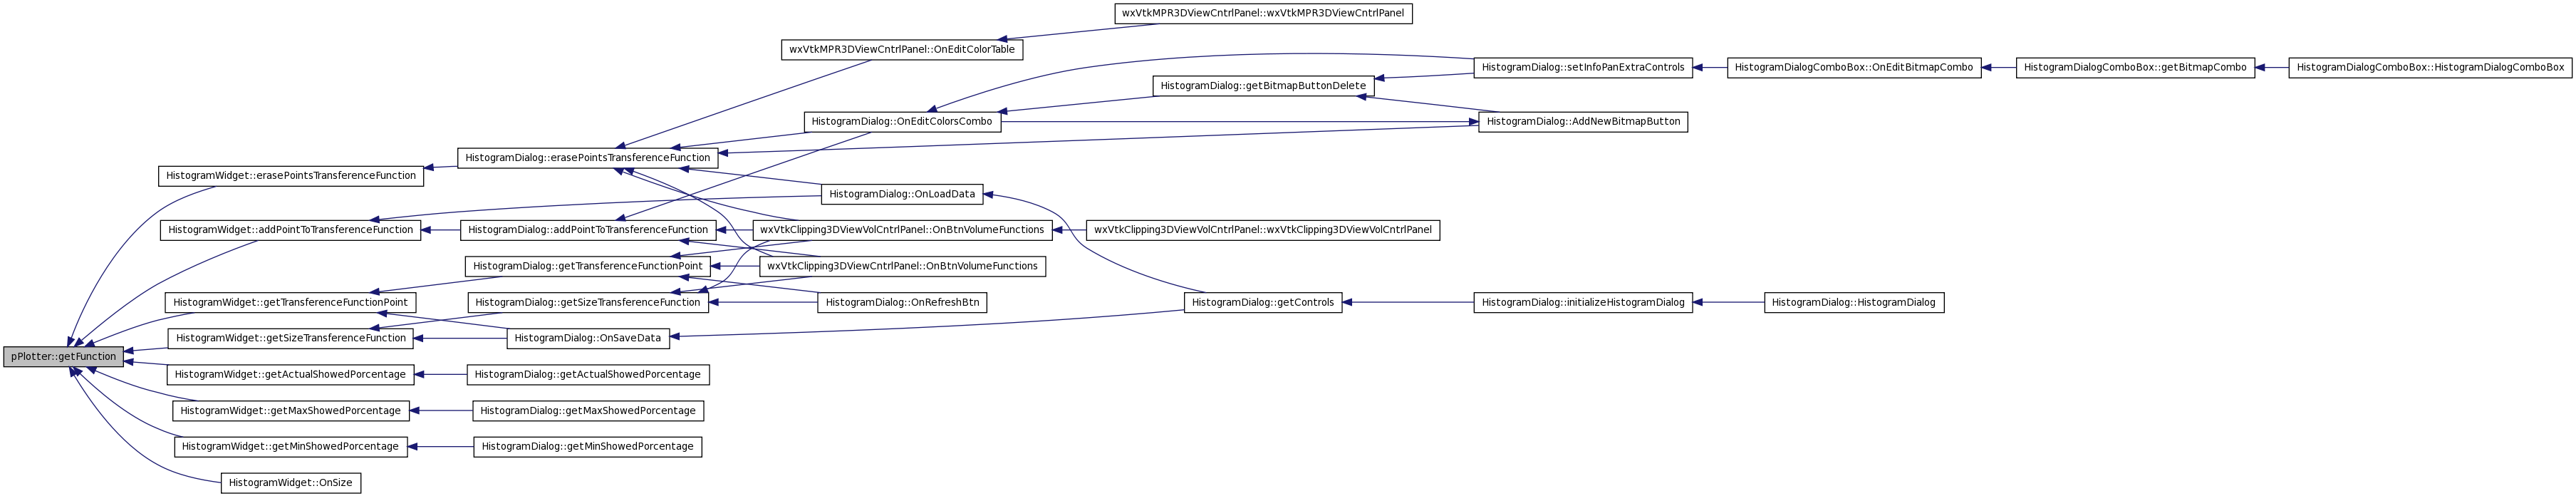
| pGraphicalFunction * pPlotter::getFunction | ( | int | index | ) |
Definition at line 571 of file pPlotter.cxx.
References pPlotterWindow::getFunction(), and m_plot.
Referenced by HistogramWidget::addPointToTransferenceFunction(), HistogramWidget::erasePointsTransferenceFunction(), HistogramWidget::getActualShowedPorcentage(), HistogramWidget::getMaxShowedPorcentage(), HistogramWidget::getMinShowedPorcentage(), HistogramWidget::getSizeTransferenceFunction(), HistogramWidget::getTransferenceFunctionPoint(), and HistogramWidget::OnSize().
00572         {
00573                 return m_plot->getFunction(index);
00574         }

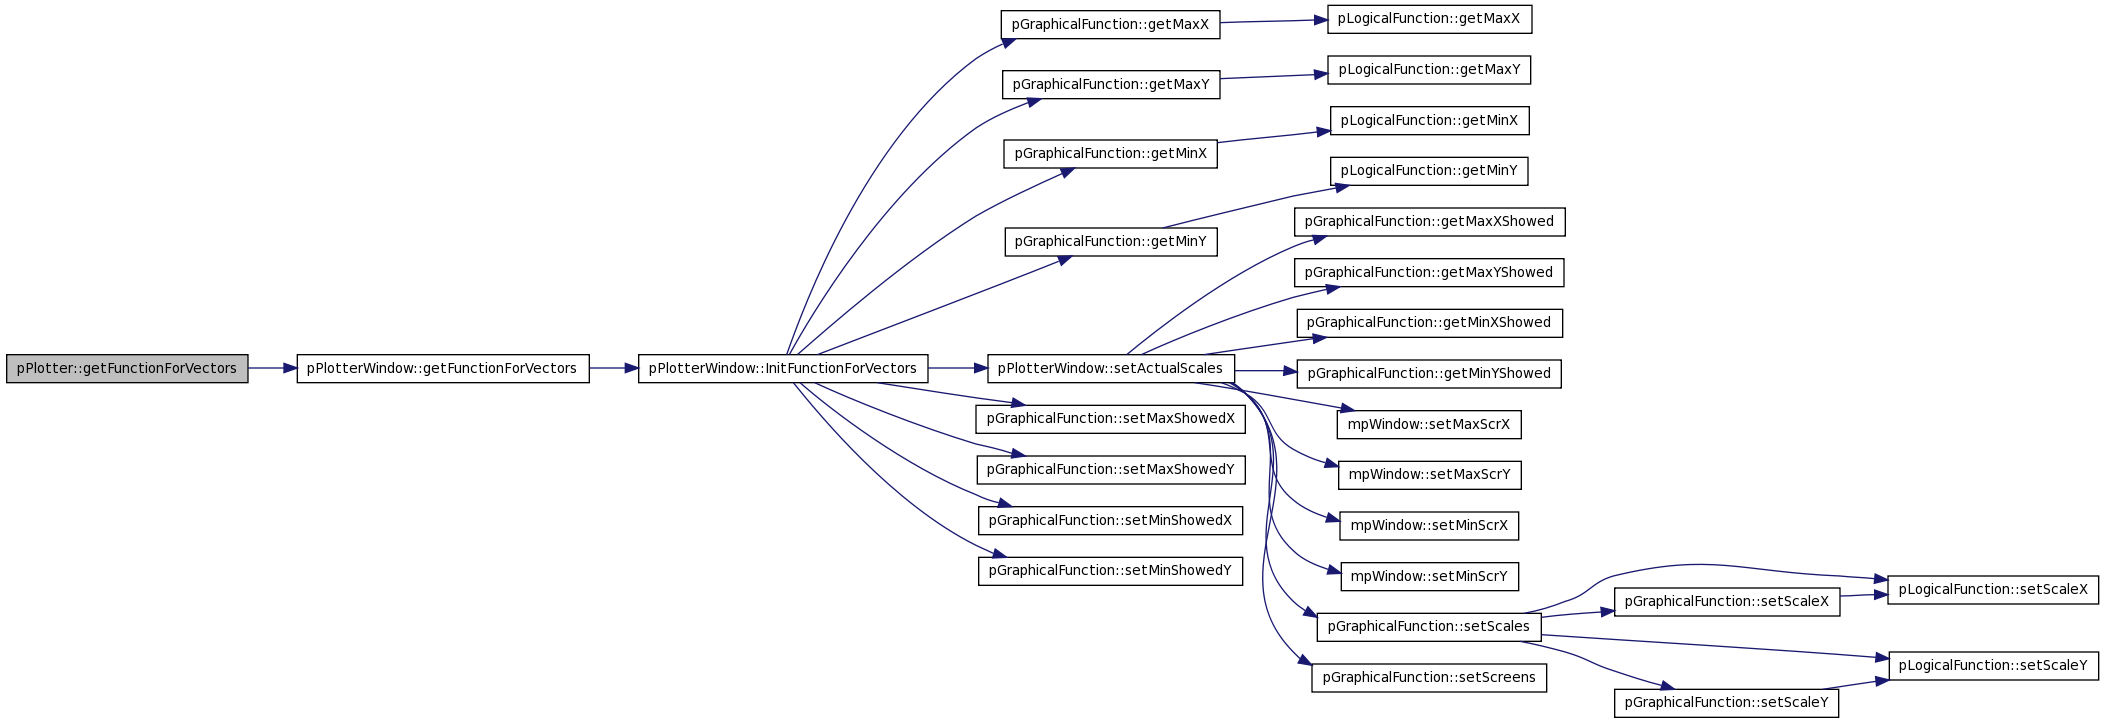
| pGraphicalFunction * pPlotter::getFunctionForVectors | ( | double * | vectorX, | |
| int | sizeX, | |||
| double * | vectorY, | |||
| int | sizeY | |||
| ) |
Creates and returns a graphical funcion according to the indicated vectors.
Definition at line 557 of file pPlotter.cxx.
References pPlotterWindow::getFunctionForVectors(), and m_plot.
Referenced by HistogramWidget::drawHistogram(), and HistogramWidget::drawTransferenceFunction().
00558         {
00559                 return m_plot->getFunctionForVectors(vectorX,sizeX, vectorY, sizeY );
00560         }

| float pPlotter::getMaxShowedPorcentage | ( | ) |
Definition at line 645 of file pPlotter.cxx.
References barrange, and mBarRange::getEndShowPorcentage().
Referenced by HistogramWidget::getMaxShowedPorcentage().
00646         {
00647                 return barrange->getEndShowPorcentage();
00648         }


| float pPlotter::getMinShowedPorcentage | ( | ) |
Definition at line 649 of file pPlotter.cxx.
References barrange, and mBarRange::getStartShowPorcentage().
Referenced by HistogramWidget::getActualShowedPorcentage(), and HistogramWidget::getMinShowedPorcentage().
00650         {
00651                 return barrange->getStartShowPorcentage();
00652         }


| wxString pPlotter::getTextMessage | ( | ) |
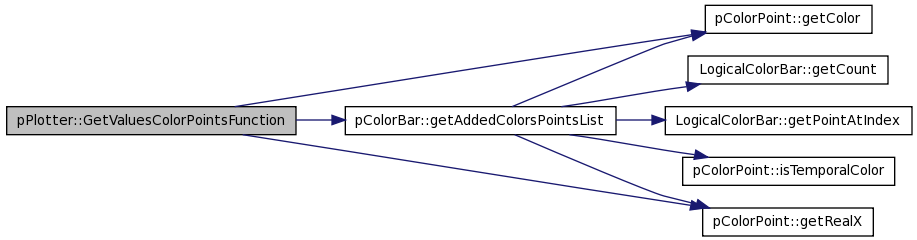
| void pPlotter::GetValuesColorPointsFunction | ( | std::vector< double > & | greylevel, | |
| std::vector< double > & | red, | |||
| std::vector< double > & | green, | |||
| std::vector< double > & | blue | |||
| ) |
Returns two vectors, the grey level of the point and its value, the red, green and blue value is between [0,1]
Definition at line 742 of file pPlotter.cxx.
References color_bar, pColorBar::getAddedColorsPointsList(), pColorPoint::getColor(), and pColorPoint::getRealX().
Referenced by HistogramWidget::GetValuesColorPointsFunction().
00746 {
00747
00748         if(color_bar != NULL){
00749
00750                 std::vector<pColorPoint*> colors;
00751         color_bar->getAddedColorsPointsList(colors);
00752
00753                 for(int i = 0; i < colors.size();i++){
00754                         pColorPoint* pcolor = colors[i];
00755
00756                         greylevel.push_back(pcolor->getRealX());
00757                         wxColour colour = pcolor->getColor();
00758
00759                         double _red = (double)(colour.Red())/255.0;
00760                         double _green = (double)(colour.Green())/255.0;
00761                         double _blue = (double)(colour.Blue())/255.0;
00762
00763                         red.push_back(_red);
00764                         green.push_back(_green);
00765                         blue.push_back(_blue);
00766                 }
00767         }
00768 }

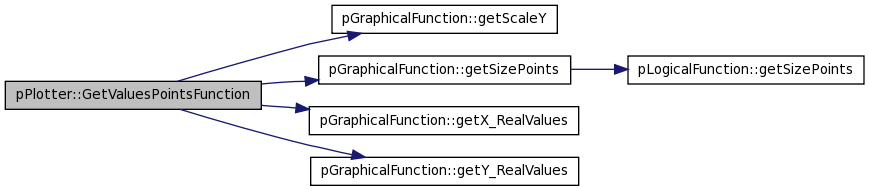
| void pPlotter::GetValuesPointsFunction | ( | std::vector< double > & | greylevel, | |
| std::vector< double > & | value, | |||
| int | histogramsize | |||
| ) |
Returns two vectors, the grey level of the point and its value, the value is between [0,1]
Definition at line 724 of file pPlotter.cxx.
References actualFunction, pGraphicalFunction::getScaleY(), pGraphicalFunction::getSizePoints(), pGraphicalFunction::getX_RealValues(), and pGraphicalFunction::getY_RealValues().
Referenced by HistogramWidget::GetValuesPointsFunction().
00725 {
00726         if(actualFunction != NULL){
00727                 double* xval = actualFunction->getX_RealValues();
00728                 double* yval = actualFunction->getY_RealValues();
00729
00730                 actualFunction->getScaleY();
00731                 for(int i = 0; i < actualFunction->getSizePoints();i++){
00732                         greylevel.push_back(xval[i]);
00733                         value.push_back(yval[i]/histogramsize);
00734                 }
00735         }
00736 }

| wxWindow* pPlotter::initialize | ( | wxWindow * | parent | ) |
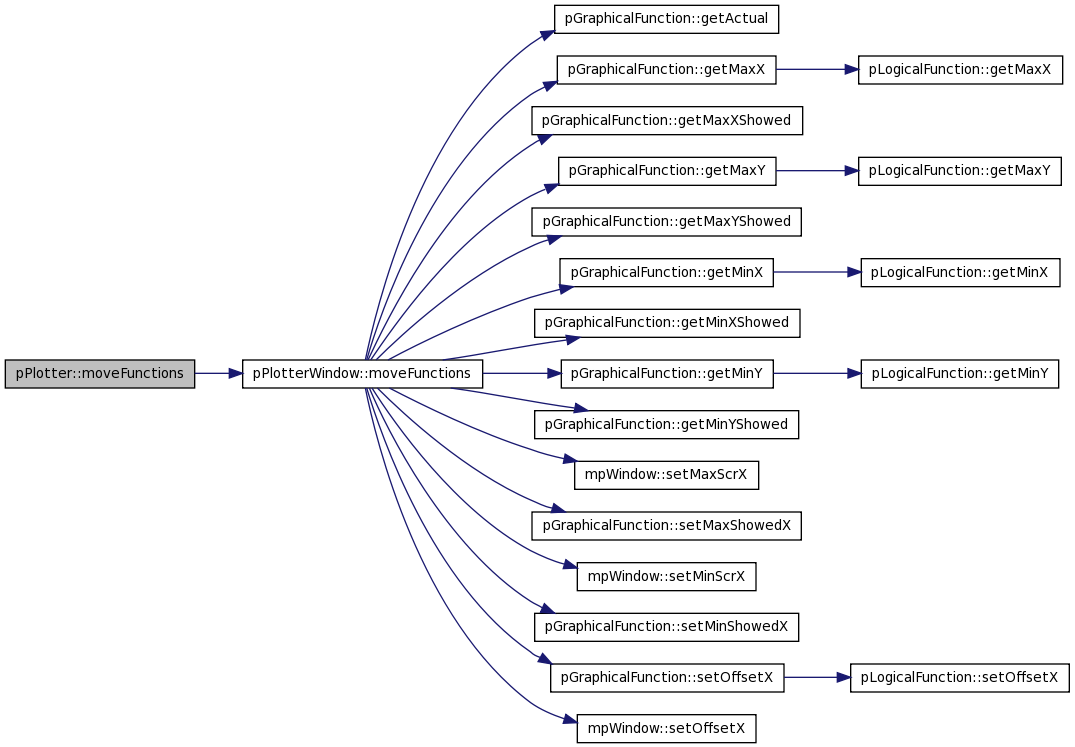
| void pPlotter::moveFunctions | ( | float | porcentageMinX, | |
| float | porcentageMaxX | |||
| ) |
Definition at line 592 of file pPlotter.cxx.
References m_plot, and pPlotterWindow::moveFunctions().
00593         {
00594                 m_plot->moveFunctions(porcentageMinX,porcentageMaxX);
00595         }
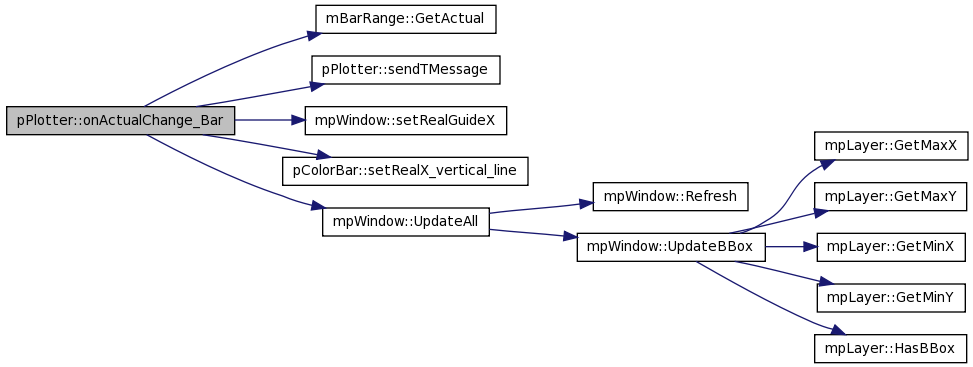
| void pPlotter::onActualChange_Bar | ( | wxCommandEvent & | event | ) |
Definition at line 415 of file pPlotter.cxx.
References barrange, color_bar, mBarRange::GetActual(), m_plot, sendTMessage(), mpWindow::setRealGuideX(), pColorBar::setRealX_vertical_line(), text, and mpWindow::UpdateAll().
00416 {
00417         text.Clear();
00418         text = _T( "Last event was on min-max bar: Actual triangle moved to: " );
00419         int lastActual_X = barrange->GetActual();
00420
00421         text << lastActual_X;
00422
00423         color_bar ->setRealX_vertical_line (lastActual_X);
00424         m_plot->setRealGuideX (lastActual_X);
00425
00426         color_bar -> RefreshForce();
00427         m_plot->UpdateAll();
00428
00429         sendTMessage(text);
00430 }
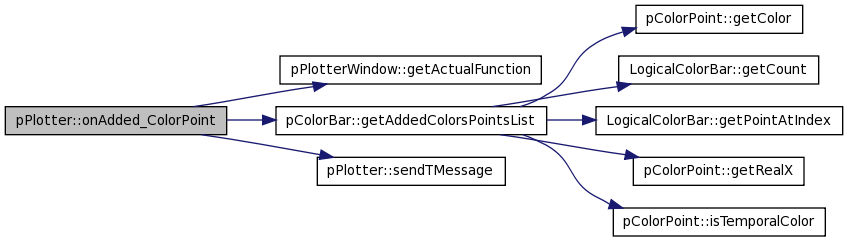
| void pPlotter::onAdded_ColorPoint | ( | wxCommandEvent & | event | ) |
Definition at line 247 of file pPlotter.cxx.
References actualFunction, color_bar, pPlotterWindow::getActualFunction(), pColorBar::getAddedColorsPointsList(), m_plot, sendTMessage(), and text.
00248 {
00249         text.Clear();
00250         text = _T( "Last event was on color bar: Color point added, total#");
00251
00252         actualFunction = m_plot->getActualFunction();
00253         if(actualFunction!=NULL)
00254         {
00255                 std::vector<pColorPoint *> actualColorPoints;
00256                 color_bar ->getAddedColorsPointsList(actualColorPoints);
00257                 actualFunction -> setColorPoints(actualColorPoints);
00258                 text << actualColorPoints.size();
00259
00260                 sendTMessage(text);
00261         }
00262 }
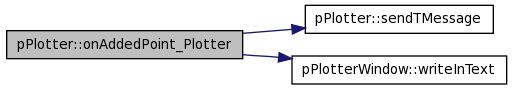
| void pPlotter::onAddedPoint_Plotter | ( | wxCommandEvent & | event | ) |
Definition at line 366 of file pPlotter.cxx.
References m_plot, sendTMessage(), text, and pPlotterWindow::writeInText().
00367 {
00368         text.Clear();
00369         m_plot->writeInText(text);
00370         sendTMessage(text);
00371 }
| void pPlotter::onBarrange | ( | wxCommandEvent & | event | ) |
Definition at line 408 of file pPlotter.cxx.
| void pPlotter::onChanged_ColorPoint | ( | wxCommandEvent & | event | ) |
Definition at line 291 of file pPlotter.cxx.
References sendTMessage(), and text.
00292 {
00293     text.Clear();
00294         sendTMessage(_T("Last event was on color bar: Color point changed color"));
00295 }

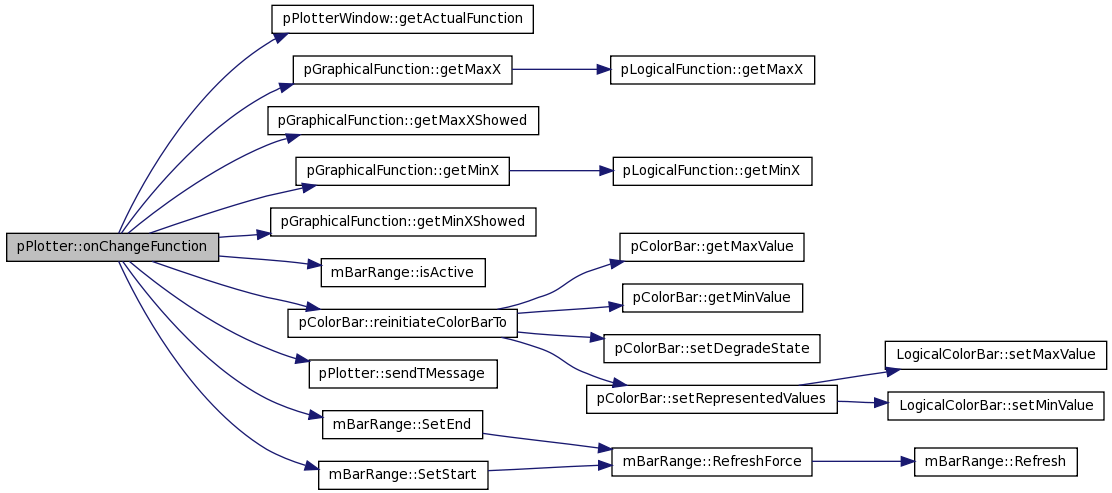
| void pPlotter::onChangeFunction | ( | wxCommandEvent & | event | ) |
Definition at line 317 of file pPlotter.cxx.
References actualFunction, barrange, color_bar, pPlotterWindow::getActualFunction(), pGraphicalFunction::getMaxX(), pGraphicalFunction::getMaxXShowed(), pGraphicalFunction::getMinX(), pGraphicalFunction::getMinXShowed(), mBarRange::isActive(), m_plot, pColorBar::reinitiateColorBarTo(), sendTMessage(), mBarRange::SetEnd(), mBarRange::SetStart(), and text.
00318 {
00319         actualFunction = m_plot->getActualFunction();
00320
00321         if (actualFunction != NULL)
00322         {
00323                 if( !barrange->isActive() )
00324                 {
00325                         barrange -> setActiveStateTo(true);
00326                         color_bar -> setActiveStateTo(true);
00327                 }
00328
00329                 text.Clear();
00330                 text = _T("Last event was on plotter: function changed, minX=");
00331                 double realMin_X = actualFunction->getMinX();
00332                 text << realMin_X;
00333                 text << _T(" maxX=");
00334                 double realMax_X = actualFunction->getMaxX();
00335                 text << realMax_X;
00336
00337                 int minShowed = actualFunction->getMinXShowed();
00338                 int maxShowed = actualFunction->getMaxXShowed();
00339
00340                 barrange -> setRepresentedValues (realMin_X, realMax_X);
00341                 barrange->SetStart( minShowed );
00342                 barrange->SetEnd( maxShowed );
00343
00344                 std::vector<pColorPoint *> actualColorPoints;
00345                 actualFunction -> getColorPoints(actualColorPoints);
00346                 if(actualColorPoints.empty())
00347                         color_bar ->reinitiateColorBar (realMin_X, realMax_X);
00348                 else
00349                         color_bar ->reinitiateColorBarTo(actualColorPoints);
00350
00351                 color_bar -> setVisibleRange ((int)realMin_X, maxShowed);
00352
00353                 // Refresh
00354                 color_bar -> RefreshForce();
00355                 barrange -> RefreshForce();
00356
00357                 sendTMessage(text);
00358         }
00359 }
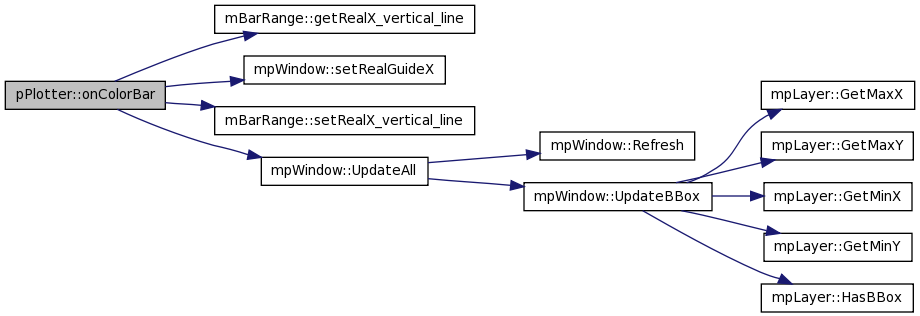
| void pPlotter::onColorBar | ( | wxCommandEvent & | event | ) |
Definition at line 297 of file pPlotter.cxx.
References barrange, mBarRange::getRealX_vertical_line(), m_plot, mpWindow::setRealGuideX(), mBarRange::setRealX_vertical_line(), and mpWindow::UpdateAll().
00298 {
00299         if( (barrange->getRealX_vertical_line())!=-1)
00300         {
00301                 barrange ->setRealX_vertical_line (-1);
00302                 m_plot->setRealGuideX (-1);
00303
00304                 barrange -> RefreshForce();
00305                 m_plot->UpdateAll();
00306         }
00307 }
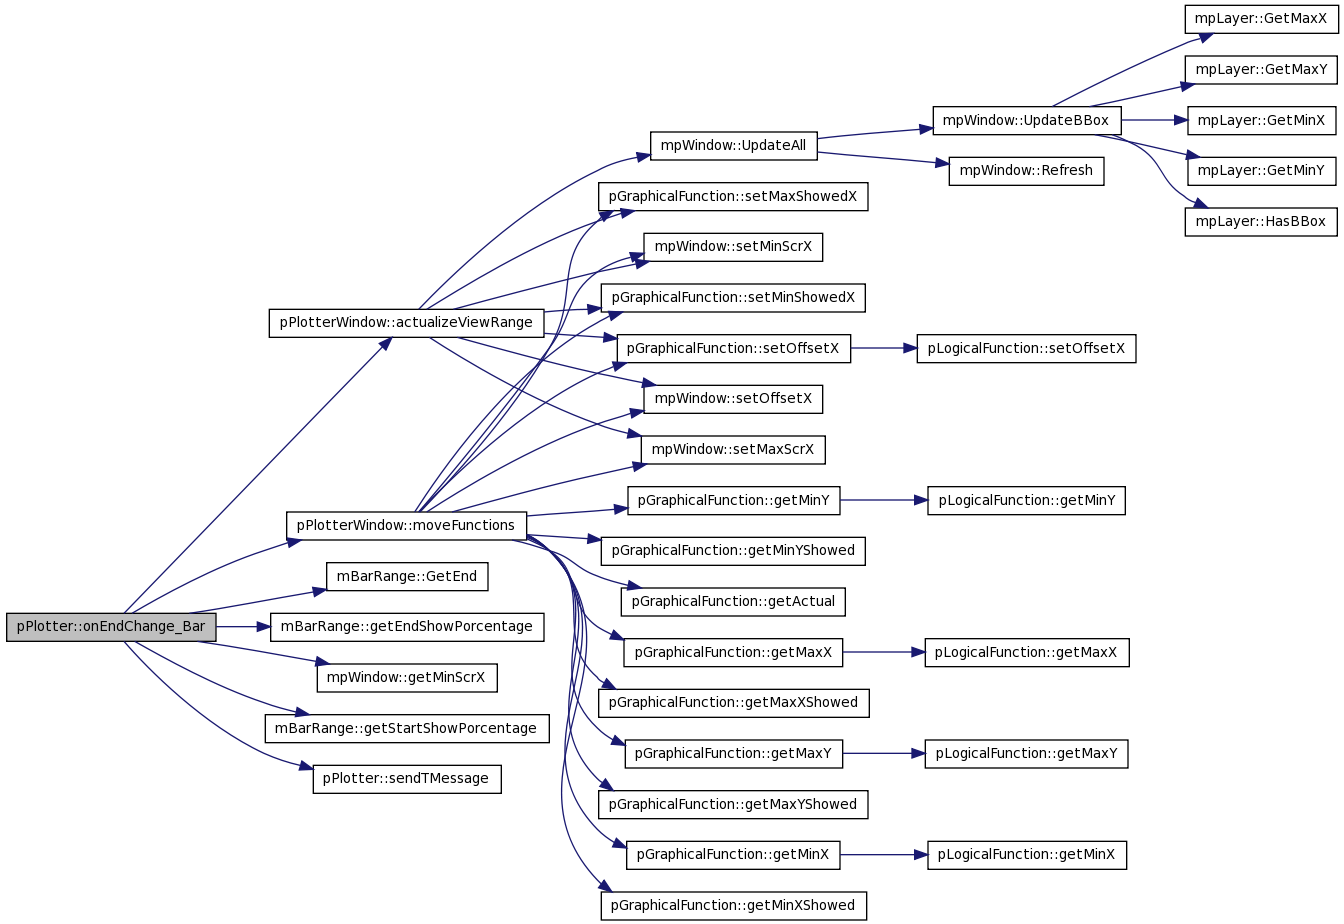
| void pPlotter::onEndChange_Bar | ( | wxCommandEvent & | event | ) |
Definition at line 461 of file pPlotter.cxx.
References pPlotterWindow::actualizeViewRange(), barrange, color_bar, mBarRange::GetEnd(), mBarRange::getEndShowPorcentage(), mpWindow::getMinScrX(), mBarRange::getStartShowPorcentage(), m_plot, pPlotterWindow::moveFunctions(), sendTMessage(), and text.
00462 {
00463         text.Clear();
00464         text += _T("Last event was on min-max bar: End  triangle moved to: ");
00465         int realMax_X = barrange->GetEnd();
00466         text += wxString::Format(_T("%d"),realMax_X);
00467         double realMin_X = m_plot->getMinScrX();
00468         color_bar -> setVisibleRange ((int)realMin_X, realMax_X);
00469         m_plot->actualizeViewRange((int)realMin_X,realMax_X);
00470
00471         float startP=(float)barrange->getStartShowPorcentage();
00472         float endP=(float)barrange->getEndShowPorcentage();
00473         m_plot->moveFunctions(startP,endP);
00474
00475         color_bar -> RefreshForce();
00476         m_plot -> UpdateAll();
00477
00478         sendTMessage(text);
00479 }
| void pPlotter::onGuideLines | ( | wxCommandEvent & | event | ) |
Definition at line 395 of file pPlotter.cxx.
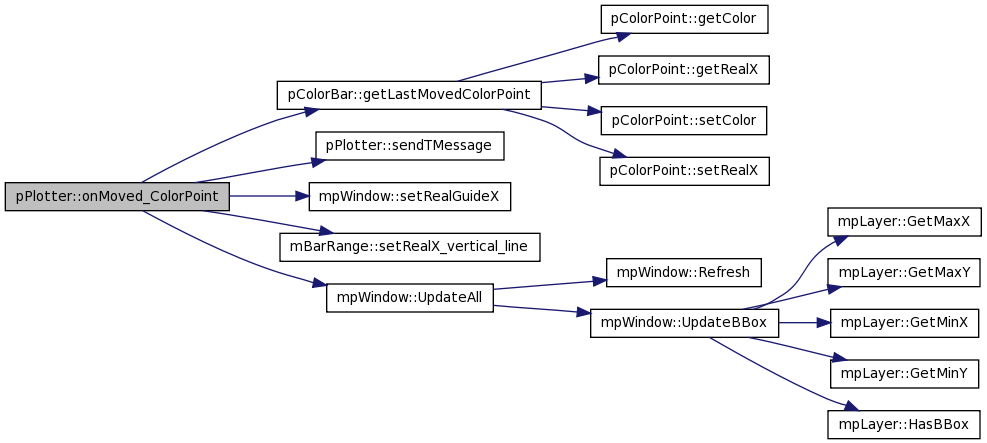
| void pPlotter::onMoved_ColorPoint | ( | wxCommandEvent & | event | ) |
Definition at line 276 of file pPlotter.cxx.
References barrange, color_bar, pColorBar::getLastMovedColorPoint(), m_plot, sendTMessage(), mpWindow::setRealGuideX(), mBarRange::setRealX_vertical_line(), text, and mpWindow::UpdateAll().
00277 {
00278         text.Clear();
00279         text = _T( "Last event was on color bar: Color point moved to: ");
00280         int lastReal_X = (int)(color_bar->getLastMovedColorPoint())->getRealX();
00281         text << lastReal_X;
00282
00283         barrange ->setRealX_vertical_line (lastReal_X);
00284         barrange -> RefreshForce();
00285
00286         m_plot->setRealGuideX (lastReal_X);
00287         m_plot->UpdateAll();
00288
00289         sendTMessage(text);
00290 }
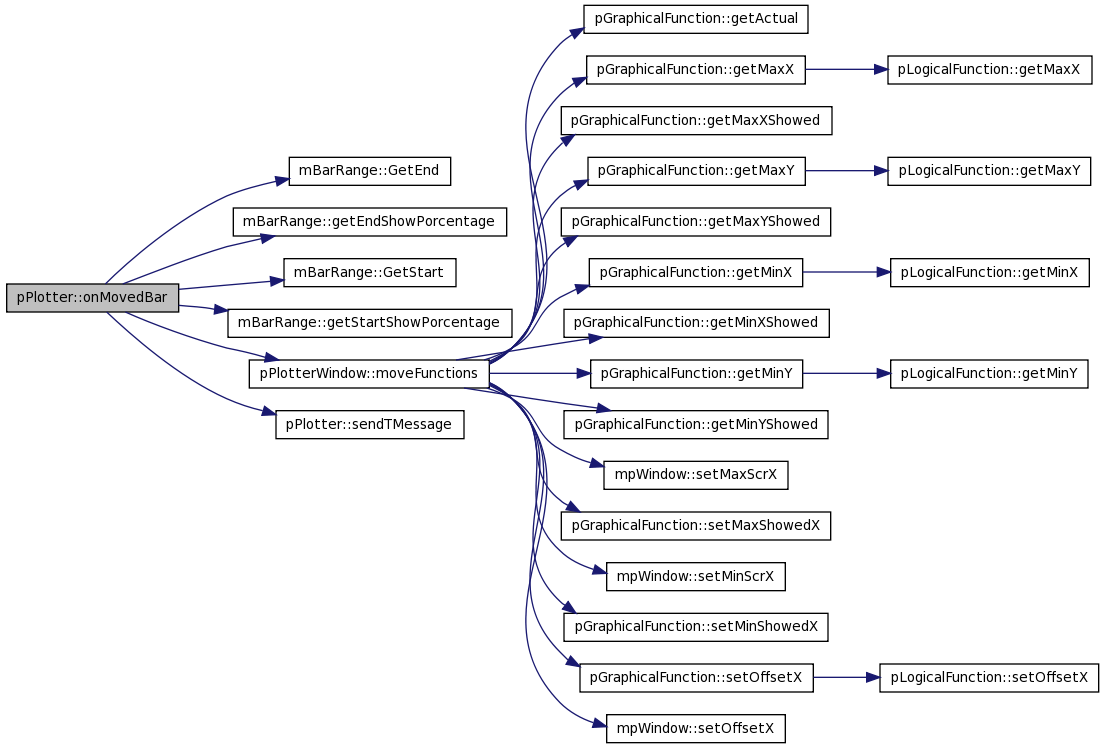
| void pPlotter::onMovedBar | ( | wxCommandEvent & | event | ) |
Definition at line 492 of file pPlotter.cxx.
References barrange, color_bar, mBarRange::GetEnd(), mBarRange::getEndShowPorcentage(), mBarRange::GetStart(), mBarRange::getStartShowPorcentage(), m_plot, pPlotterWindow::moveFunctions(), sendTMessage(), and text.
00493 {
00494         text.Clear();
00495         text = _T( "Last event was on min-max bar: Moved bar to min:" );
00496
00497         int realMin_X = barrange->GetStart();
00498         text +=  wxString::Format(_T("%d"),realMin_X);
00499         text +=  _T(" max:");
00500
00501         int realMax_X = barrange->GetEnd();
00502         text +=  wxString::Format(_T("%d"),realMax_X);
00503
00504         color_bar -> setVisibleRange (realMin_X, realMax_X);
00505
00506         float startP=(float)barrange->getStartShowPorcentage();
00507         float endP=(float)barrange->getEndShowPorcentage();
00508         m_plot->moveFunctions(startP,endP);
00509
00510         color_bar -> RefreshForce();
00511         m_plot -> UpdateAll();
00512
00513         sendTMessage(text);
00514 }
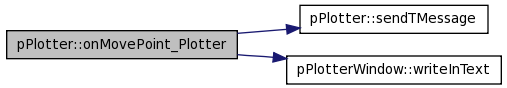
| void pPlotter::onMovePoint_Plotter | ( | wxCommandEvent & | event | ) |
Definition at line 386 of file pPlotter.cxx.
References m_plot, sendTMessage(), text, and pPlotterWindow::writeInText().
00387 {
00388         text.Clear();
00389         m_plot->writeInText(text);
00390         sendTMessage(text);
00391 }
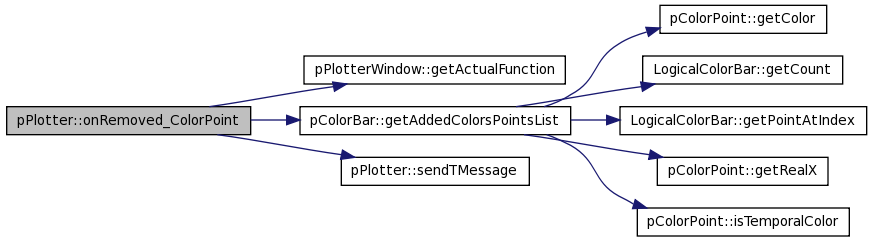
| void pPlotter::onRemoved_ColorPoint | ( | wxCommandEvent & | event | ) |
Definition at line 263 of file pPlotter.cxx.
References actualFunction, color_bar, pPlotterWindow::getActualFunction(), pColorBar::getAddedColorsPointsList(), m_plot, sendTMessage(), and text.
00264 {
00265         text.Clear();
00266         text = _T( "Last event on color bar: Color point removed total#");
00267
00268         actualFunction = m_plot->getActualFunction();
00269         std::vector<pColorPoint *> actualColorPoints;
00270         color_bar ->getAddedColorsPointsList(actualColorPoints);
00271         actualFunction -> setColorPoints(actualColorPoints);
00272         text << actualColorPoints.size();
00273
00274         sendTMessage(text);
00275 }
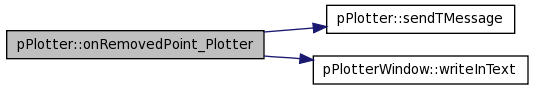
| void pPlotter::onRemovedPoint_Plotter | ( | wxCommandEvent & | event | ) |
Definition at line 376 of file pPlotter.cxx.
References m_plot, sendTMessage(), text, and pPlotterWindow::writeInText().
00377 {
00378         text.Clear();
00379         m_plot->writeInText(text);
00380         sendTMessage(text);
00381 }
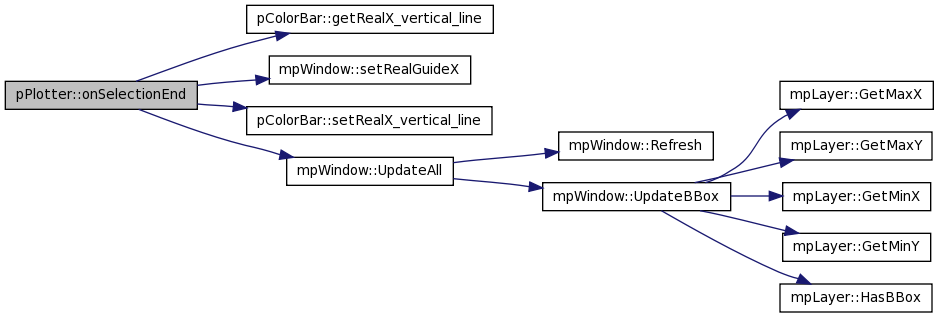
| void pPlotter::onSelectionEnd | ( | wxCommandEvent & | event | ) |
Definition at line 481 of file pPlotter.cxx.
References color_bar, pColorBar::getRealX_vertical_line(), m_plot, mpWindow::setRealGuideX(), pColorBar::setRealX_vertical_line(), and mpWindow::UpdateAll().
00482 {
00483         if( (color_bar->getRealX_vertical_line())!=-1)
00484         {
00485                 color_bar ->setRealX_vertical_line (-1);
00486                 m_plot->setRealGuideX (-1);
00487
00488                 color_bar -> RefreshForce();
00489                 m_plot->UpdateAll();
00490         }
00491 }
| void pPlotter::OnSize | ( | wxSizeEvent & | WXUNUSEDevent | ) |
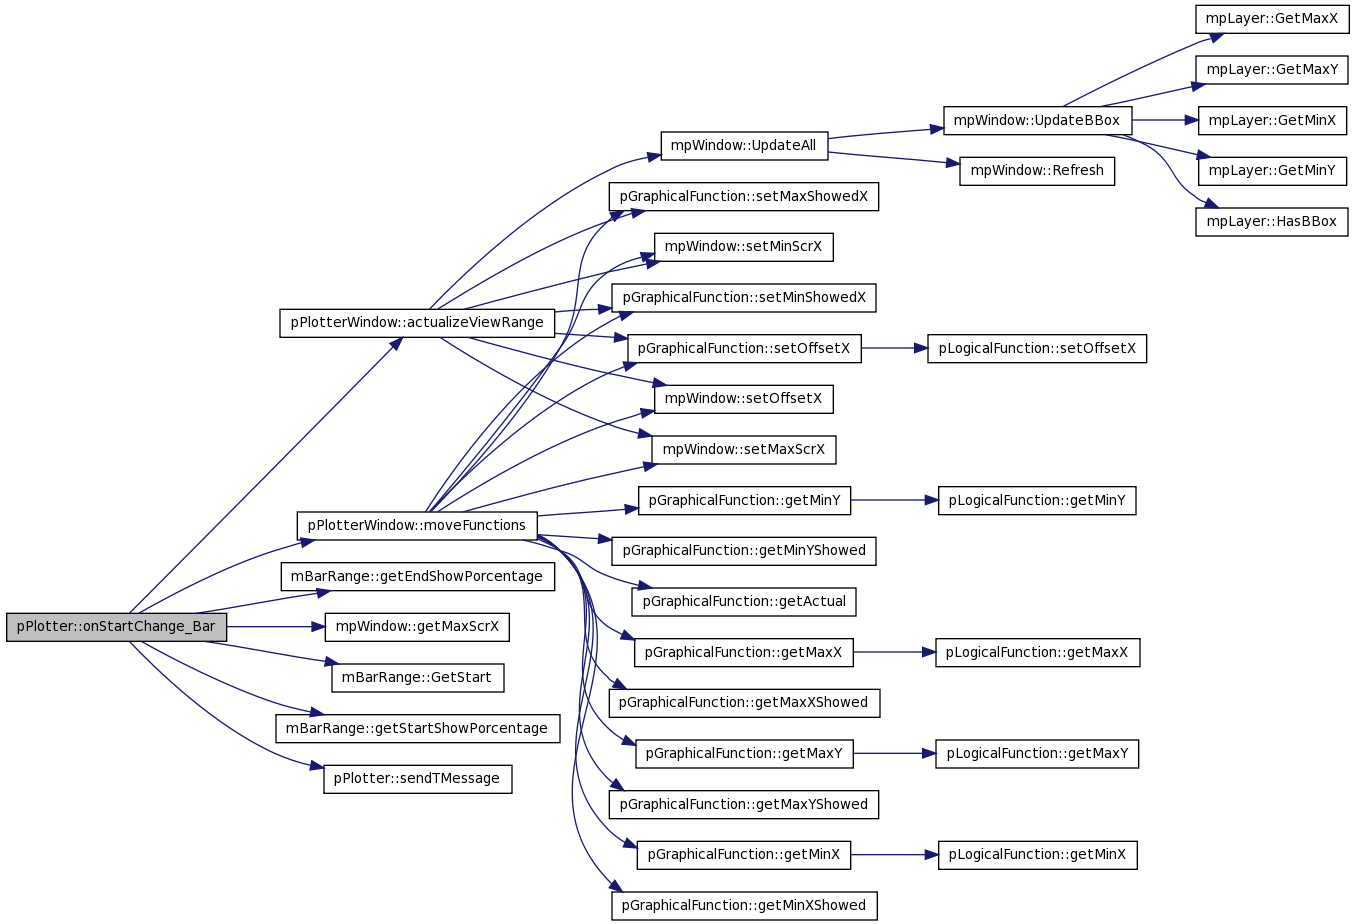
| void pPlotter::onStartChange_Bar | ( | wxCommandEvent & | event | ) |
Definition at line 435 of file pPlotter.cxx.
References pPlotterWindow::actualizeViewRange(), barrange, color_bar, mBarRange::getEndShowPorcentage(), mpWindow::getMaxScrX(), mBarRange::GetStart(), mBarRange::getStartShowPorcentage(), m_plot, pPlotterWindow::moveFunctions(), sendTMessage(), and text.
00436 {
00437         text.Clear();
00438
00439         text = _T( "Last event was on min-max bar: Start triangle moved to: ");
00440         int realMin_X = barrange->GetStart();
00441         text += wxString::Format(_T("%d"), realMin_X);
00442         double realMax_X = m_plot->getMaxScrX();
00443
00444         color_bar -> setVisibleRange (realMin_X, (int)realMax_X);
00445
00446         m_plot->actualizeViewRange(realMin_X, (int)realMax_X);
00447
00448         //setting the plotter for draw the functions that
00449         //it has to move.
00450
00451         float startP=(float)barrange->getStartShowPorcentage();
00452         float endP=(float)barrange->getEndShowPorcentage();
00453         m_plot->moveFunctions(startP,endP);
00454
00455         //Updating
00456         color_bar -> RefreshForce();
00457         m_plot -> UpdateAll();
00458         sendTMessage(text);
00459 }
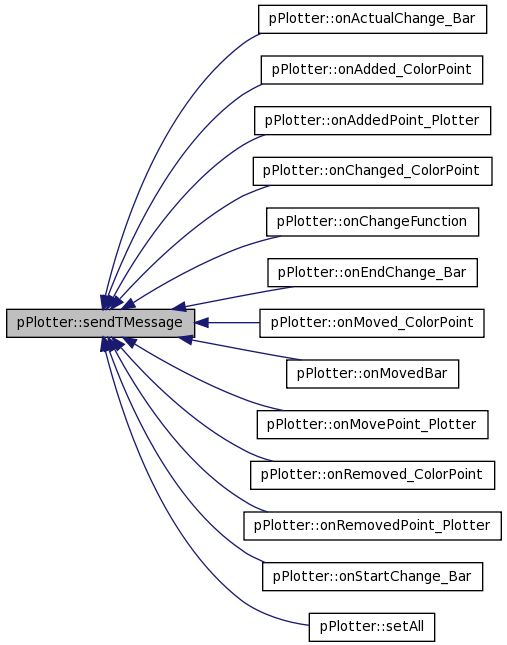
| void pPlotter::sendTMessage | ( | wxString | theText | ) |
Definition at line 520 of file pPlotter.cxx.
Referenced by onActualChange_Bar(), onAdded_ColorPoint(), onAddedPoint_Plotter(), onChanged_ColorPoint(), onChangeFunction(), onEndChange_Bar(), onMoved_ColorPoint(), onMovedBar(), onMovePoint_Plotter(), onRemoved_ColorPoint(), onRemovedPoint_Plotter(), onStartChange_Bar(), and setAll().
00521 {
00522         //Creating a message event
00523         wxCommandEvent puntualMSG_Event( wxEVT_NW_TEXT_MESAGGE, GetId() );
00524         puntualMSG_Event.SetEventObject(this);
00525         //Sending the event
00526         GetEventHandler()->ProcessEvent( puntualMSG_Event );
00527 }
| void pPlotter::setActual | ( | pGraphicalFunction * | nActual | ) |
Definition at line 661 of file pPlotter.cxx.
References m_plot, and pPlotterWindow::setActualFunction().
00662         {
00663                 m_plot->setActualFunction(nActual);
00664         }

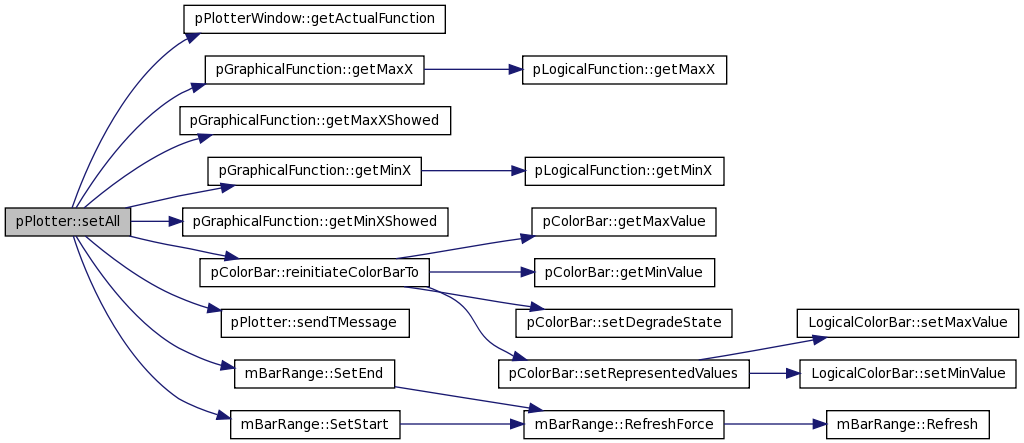
| void pPlotter::setAll | ( | ) |
Definition at line 197 of file pPlotter.cxx.
References actualFunction, barrange, color_bar, pPlotterWindow::getActualFunction(), pGraphicalFunction::getMaxX(), pGraphicalFunction::getMaxXShowed(), pGraphicalFunction::getMinX(), pGraphicalFunction::getMinXShowed(), m_plot, pColorBar::reinitiateColorBarTo(), sendTMessage(), mBarRange::SetEnd(), mBarRange::SetStart(), and text.
00198 {
00199         actualFunction = m_plot->getActualFunction();
00200
00201         if (actualFunction != NULL)
00202         {
00203                 barrange -> setActiveStateTo(true);
00204                 color_bar -> setActiveStateTo(true);
00205
00206                 text.Clear();
00207                 text = _T("minX=");
00208                 double realMin_X = actualFunction->getMinX();
00209                 text = text + realMin_X;
00210                 text = text + _T(" maxX=");
00211                 double realMax_X = actualFunction->getMaxX();
00212                 text = text + realMax_X;
00213
00214                 int minShowed = actualFunction->getMinXShowed();
00215                 int maxShowed = actualFunction->getMaxXShowed();
00216
00217                 barrange -> setRepresentedValues (realMin_X, realMax_X);
00218                 barrange->SetStart( minShowed );
00219                 barrange->SetEnd( maxShowed );
00220
00221
00222                 std::vector<pColorPoint *> actualColorPoints;
00223                 actualFunction -> getColorPoints(actualColorPoints);
00224                 if(actualColorPoints.empty())
00225                         color_bar ->reinitiateColorBar (realMin_X, realMax_X);
00226                 else
00227                         color_bar ->reinitiateColorBarTo(actualColorPoints);
00228
00229                 color_bar -> setVisibleRange (minShowed, maxShowed);
00230
00231                 // Refresh
00232                 color_bar -> RefreshForce();
00233                 barrange -> RefreshForce();
00234
00235                 sendTMessage(text);
00236         }
00237 }
| void pPlotter::setPopUpMenu | ( | bool | startD, | |
| bool | stopD, | |||
| bool | smooth, | |||
| bool | line, | |||
| bool | zoomIn, | |||
| bool | zoomOut, | |||
| bool | showPoints, | |||
| bool | noShowPoints, | |||
| bool | changeColor, | |||
| bool | addP, | |||
| bool | delPoint, | |||
| bool | load, | |||
| bool | save | |||
| ) |
Definition at line 685 of file pPlotter.cxx.
References m_plot, and pPlotterWindow::setPopUpMenu().
Referenced by HistogramWidget::HistogramWidget().
00688         {
00689                 m_plot->setPopUpMenu(startD, stopD, smooth, line,  zoomIn,
00690                                            zoomOut, showPoints, noShowPoints, changeColor,  addP,
00691                                            delPoint, load, save);
00692         }


| void pPlotter::setTextMessage | ( | wxString | nMessage | ) |
Definition at line 533 of file pPlotter.cxx.
References text.
00534         {
00535                 text = nMessage;
00536         }
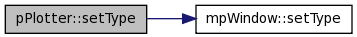
| void pPlotter::setType | ( | int | t | ) |
Definition at line 564 of file pPlotter.cxx.
References m_plot, and mpWindow::setType().
Referenced by HistogramWidget::HistogramWidget().

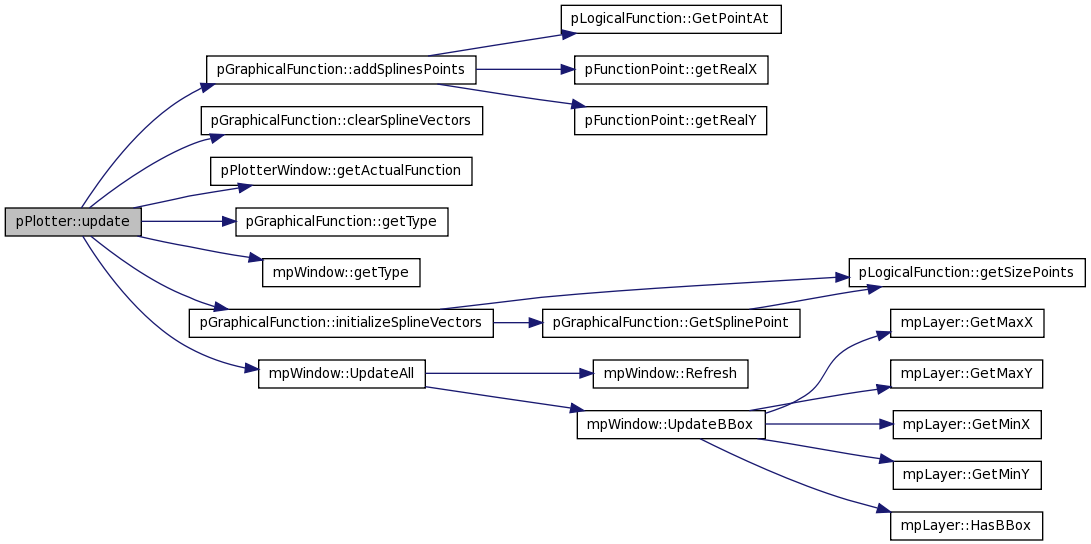
| void pPlotter::update | ( | ) |
Definition at line 665 of file pPlotter.cxx.
References pGraphicalFunction::addSplinesPoints(), pGraphicalFunction::clearSplineVectors(), pPlotterWindow::getActualFunction(), pGraphicalFunction::getType(), mpWindow::getType(), pGraphicalFunction::initializeSplineVectors(), m_plot, and mpWindow::UpdateAll().
Referenced by HistogramWidget::updatePlotter().
00666         {
00667                 //if it is a plotter of histograms
00668                 if(m_plot->getType()==2)
00669                 {
00670                         pGraphicalFunction* tf= m_plot->getActualFunction();
00671                         if(tf->getType()==2)
00672                         {
00673                                 tf->clearSplineVectors();
00674                                 tf->addSplinesPoints();
00675                                 tf->initializeSplineVectors();
00676                         }
00677                 }
00678
00679                 m_plot->UpdateAll();
00680         }

Member Data Documentation
pGraphicalFunction* pPlotter::actualFunction [private] |
Definition at line 242 of file pPlotter.h.
Referenced by GetValuesPointsFunction(), onAdded_ColorPoint(), onChangeFunction(), onRemoved_ColorPoint(), and setAll().
mBarRange* pPlotter::barrange [private] |
Definition at line 238 of file pPlotter.h.
Referenced by getActualShowedPorcentage(), getMaxShowedPorcentage(), getMinShowedPorcentage(), onActualChange_Bar(), onChangeFunction(), onColorBar(), onEndChange_Bar(), onMoved_ColorPoint(), onMovedBar(), onStartChange_Bar(), and setAll().
pColorBar* pPlotter::color_bar [private] |
Definition at line 234 of file pPlotter.h.
Referenced by addColorPoint(), eraseColorPoints(), getBarColorDataAt(), getColorPointsSize(), GetValuesColorPointsFunction(), onActualChange_Bar(), onAdded_ColorPoint(), onChangeFunction(), onEndChange_Bar(), onMoved_ColorPoint(), onMovedBar(), onRemoved_ColorPoint(), onSelectionEnd(), onStartChange_Bar(), and setAll().
pPlotterWindow* pPlotter::m_plot [private] |
Definition at line 230 of file pPlotter.h.
Referenced by addFunction(), addFunctionToMove(), getFunction(), getFunctionForVectors(), moveFunctions(), onActualChange_Bar(), onAdded_ColorPoint(), onAddedPoint_Plotter(), onChangeFunction(), onColorBar(), onEndChange_Bar(), onMoved_ColorPoint(), onMovedBar(), onMovePoint_Plotter(), onRemoved_ColorPoint(), onRemovedPoint_Plotter(), onSelectionEnd(), onStartChange_Bar(), setActual(), setAll(), setPopUpMenu(), setType(), and update().
wxString pPlotter::text [private] |
Definition at line 247 of file pPlotter.h.
Referenced by getTextMessage(), onActualChange_Bar(), onAdded_ColorPoint(), onAddedPoint_Plotter(), onChanged_ColorPoint(), onChangeFunction(), onEndChange_Bar(), onMoved_ColorPoint(), onMovedBar(), onMovePoint_Plotter(), onRemoved_ColorPoint(), onRemovedPoint_Plotter(), onStartChange_Bar(), setAll(), and setTextMessage().
The documentation for this class was generated from the following files:
- /home/davila/Creatis/creaMaracasVisu/lib/maracasVisuLib/src/interface/wxWindows/widgets/pPlotter/pPlotter.h
- /home/davila/Creatis/creaMaracasVisu/lib/maracasVisuLib/src/interface/wxWindows/widgets/pPlotter/pPlotter.cxx