MYOSAIQ dataset
-
Protocol
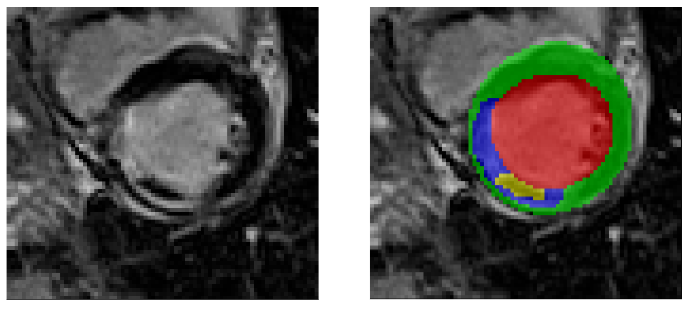
The myocardial and lesion contours were manually segmented offline on LGE images by one experienced observer and controlled by two other experienced observers. They consisted of the endocardium, epicardium, infarct, and microvascular obstruction (MVO). The infarct zone was determined semi-automatically using the full-width half-maximum method, supervised by the user and corrected if needed. MVO corresponded to hypo-enhancement within the infarct zone, and was segmented manually. Groundtruth label images were created where 0, 1, 2, 3 and 4 represent voxels located in the background, in the LV cavity, in the myocardium with healthy tissue, in the infarct zone, and in the MVO.
The figure below shows an example of an LGE image extracted from the database (left image) with the corresponding reference mask overlay (right image) calculated from the manual annotations. In this image, red corresponds to the LV cavity, green to the myocardium with healthy tissue, blue to the infarct zone and yellow to the MVO.